 Hội Nội Tiết – Đái Tháo Đường Miền Trung Việt Nam Hội Nội Tiết – Đái Tháo Đường Miền Trung Việt Nam
UNDERSTANDING ST EQUIVALENTS ON ECG
PART I
Quoc Bao Tran, Anh Khoa Phan, Anh Binh Ho
Department of Emergency and Cardiology Interventional,
Hue Central Hospital
DOI: 10.47122/vjde.2020.40.9
Keywords: Acute coronary syndrome, ST equivalents, ECG.
Main correspondence: Ho Anh Binh
Submission date: 5th May 2020
Revised date: 15th May 2020
Acceptance date: 26th June 2020
Email: [email protected]
INTRODUCTION
Acute coronary syndrome (ACS) is a syndrome due to decreased blood flow in the coronary arteries such that part of the heart muscle is unable to function properly or dies. Even though the detection of a rise and/or fall of cTn values with at least one value above the 99th percentile URL is the key in diagnose of ACS, the role of electrocardiogram (ECG) still plays an important role in ACS simply because of its sensitivity and specificity. In clinical practice, ST-Elevation Myocardial infarction (STEMI) is easy for physicians and cardiologists to identify. STEMI is defined by new ST-elevation at the J-point in the absence of left ventricular hypertrophy and bundle branch block with two contiguous leads with cut-point: ≥ 1mm in all leads other than V2-V3 where the following cut-point apply: ≥ 2mm in men ≥ 40 years; ≥2.5mm in men < 40 years, or ≥ 1.5mm in women regardless of age.
In reality, many acute myocardial infarction patients with ST deviations observed in other conditions in which the characteristics of these ECG do not meet the criteria of STEMI. They are called: ST equivalents. STEMI equivalents represent coronary occlusion without meeting the traditional STE criteria and are equally important to recognize in a timely fashion. Emergency physicians must know to involve interventional cardiologists for patients with dynamic ECG changes, persistent ischemic chest pain, hemodynamic instability, and STEMI equivalent patterns that require emergent PCI to minimize morbidity and mortality. This is the reason why we would like to propose this review to present some common ST equivalents for physicians and cardiologists to apply to the clinical practice. These are: de Winter ST/T complex, Wellens syndromes, ST-elevation in lead AVR, LBBB with Sgarbossa criteria, isolated posterior MI, T waves upright in V1 [1], [5],[10].
De Winter ST/T complex:
This ECG pattern was described in 2008 by de Winter RJ, et al. in 2008 with a case series that described this pattern occurring in approximately 2% of LAD occlusions.This pattern, as seen on ECG #1, demonstrates > 1 mm of upsloping STD and tall symmetric T-waves, most commonly in the precordial leads. There may be 0.5-1 mm STE in aVR, but there should be no STE in the precordial leads. Patients with this ECG pattern and a presentation concerning for ACS warrant immediate revascularization.
l Verounden and colleagues replicated this finding in a 2009 case series. They found a de Winter ECG pattern in 35/1890 patients requiring PCI to the LAD (2% of cases). Patients with the de Winter ECG pattern were younger, more likely to be male and with a higher incidence of hypercholesterolaemia compared to patients with a classic STEMI pattern.
l There is now growing evidence to suggest that the de Winter ECG pattern is highly predictive of acute LAD occlusion.
l Some authors have proposed that the de Winter pattern should be considered a “STEMI equivalent”, and that patients with chest pain and this ECG pattern should receive emergent reperfusion therapy with PCI or thrombolysis[8], [2], [11], [4].
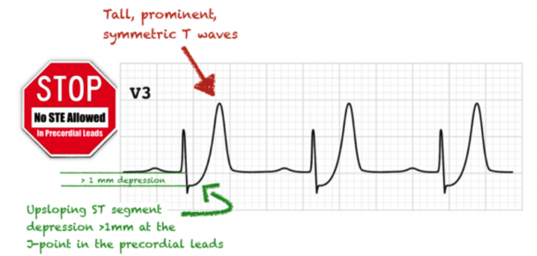
Figure 1. De Winter ECG pattern
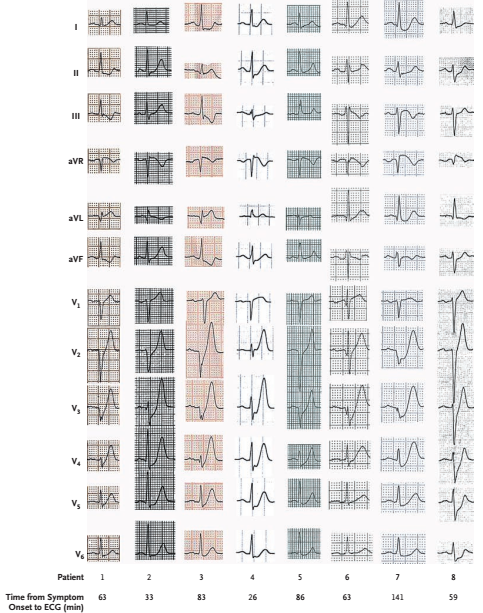
Figure 2. Unique Precordial ST-Segment and T-Wave Morphology. These 12-lead ECG recordings of eight patients show precordial ST-segment depression at the J point followed by peaked, positive T waves. In addition, lead aVR shows slight ST-segment elevation in most cases. All eight of these patients underwent primary percutaneous coronary intervention because of an occlusion of the proximal LAD [2].
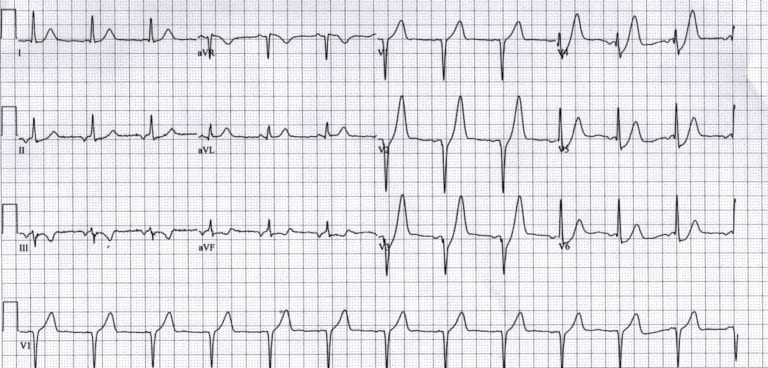
Figure 3.
- Upsloping ST depression in the precordial leads (> 1mm at J-point).
- Peaked anterior T waves (V2-6), with the ascending limb of the T wave commencing below the isoelectric baseline.
- Subtle ST elevation in aVR > 0.5mm [4].
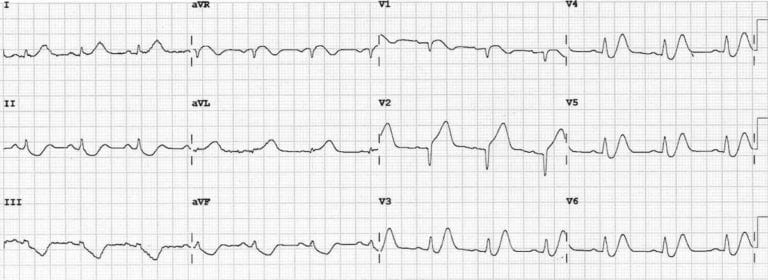
Figure 4. This great ECG demonstrates de Winter’s T waves combined with features of anterior STEMI — the patient ultimately turned out to have an acute proximal LAD occlusion.
- Upsloping ST depression and peaked T waves (De Winter’s T waves) in V3-6.
- ST elevation in the septal (V1-2) and high lateral leads (I & aVL) with inferior reciprocal change, consistent with an LAD occlusion proximal to the 1st diagonal [4].
2. Wellens syndromes
Wellen’s syndrome, is a pattern of deeply inverted or biphasic T waves in V2-V3, which is highly specific for a critical stenosis of the left anterior descending artery (LAD), also called LAD coronary syndrome or widow maker, was first described in 1982 by de Zwaan et al in a subgroup of patients with unstable angina during a pain-free period. Seven years later, the same authors performed another prospective study on patients with Wellen’s syndrome and confirmed 100% association with a significant proximal LAD disease by cardiac coronary angiography [3].
Diagnostic Criteria
Rhinehart et al (2002) describe the following diagnostic criteria for Wellens syndrome [9]:
- Deeply-inverted or biphasic T waves in V2-3 (may extend to V1-6)
- Isoelectric or minimally-elevated ST segment (< 1mm)
- No precordial Q waves
- Preserved precordial R wave progression
- Recent history of angina
- ECG pattern present in pain-free state
- Normal or slightly elevated serum cardiac markers
There are two patterns of T-wave abnormality in Wellens syndrome:
- Type A– Biphasic, with initial positivity and terminal negativity (25% of cases)
- Type B– Deeply and symmetrically inverted (75% of cases)
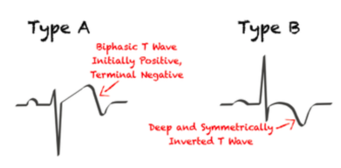
Figure 6. Two patterns of Wellens Syndrome []
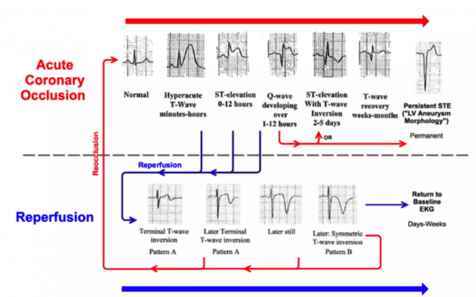
Figure 7. T wave changes
Understanding The T Wave Changes
The following sequence of events is thought to occur in patients with Wellens syndrome:
- A sudden occlusion of the LAD, causing a transient anterior STEMI. The patient has chest pain & diaphoresis. This stage may not be successfully captured on an ECG recording.
- Re-perfusion of the LAD (e.g. due to spontaneous clot lysis or prehospital aspirin). The chest pain resolves. ST elevation improves and T waves become biphasic or inverted. The T wave morphology is identical to patients who reperfuse after a successful PCI.
- If the artery remains open, the T waves evolve over time from biphasic to deeply inverted.
- The coronary perfusion is unstable, however, and the LAD can re-occlude at any time. If this happens, the first sign on the ECG is an apparent normalisation of the T waves — so-called “pseudo-normalisation”. The T waves switch from biphasic/inverted to upright and prominent. This is a sign of hyperacute STEMI and is usually accompanied by recurrence of chest pain, although the ECG changes can precede the symptoms.
- If the artery remains occluded, the patient now develops an evolving anterior STEMI.
- Alternatively, a “stuttering” pattern may develop, with intermittent reperfusion and re-occlusion. This would manifest as alternating ECGs demonstrating Wellens and pseudonormalisation/STEMI patterns.
This sequence of events is not limited to the anterior leads — similar changes may be seen in the inferior or lateral leads, e.g. with RCA or circumflex occlusion.
Also, the inciting event does not necessarily have to be thrombus formation: Wellens syndrome may also occur in normal coronary arteries following an episode of vasospasm, as in this case of cocaine-induced vasospasm [3], [6].
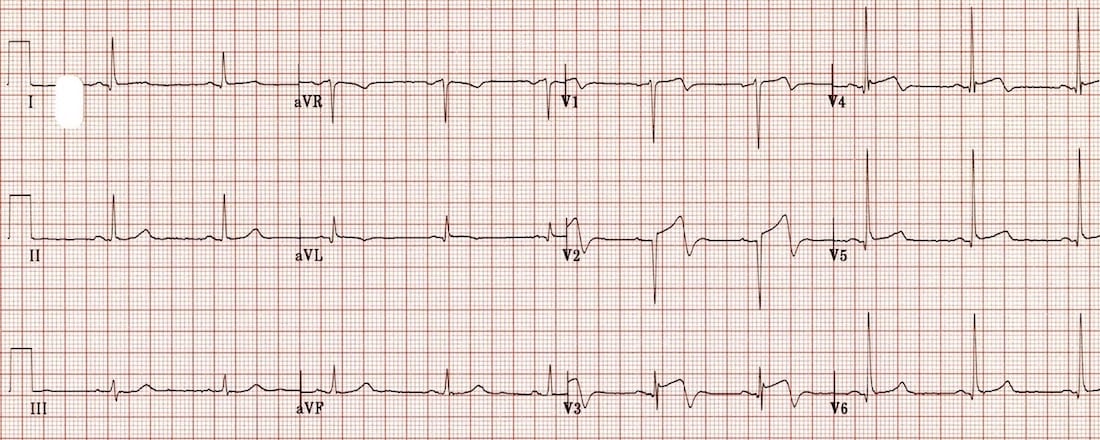
Figure 8.
- Biphasic precordial T waves with terminal negativity, most prominent in V2-3.
- Minor precordial ST elevation.
- Preserved R wave progression (R wave in V3 > 3mm)[6]
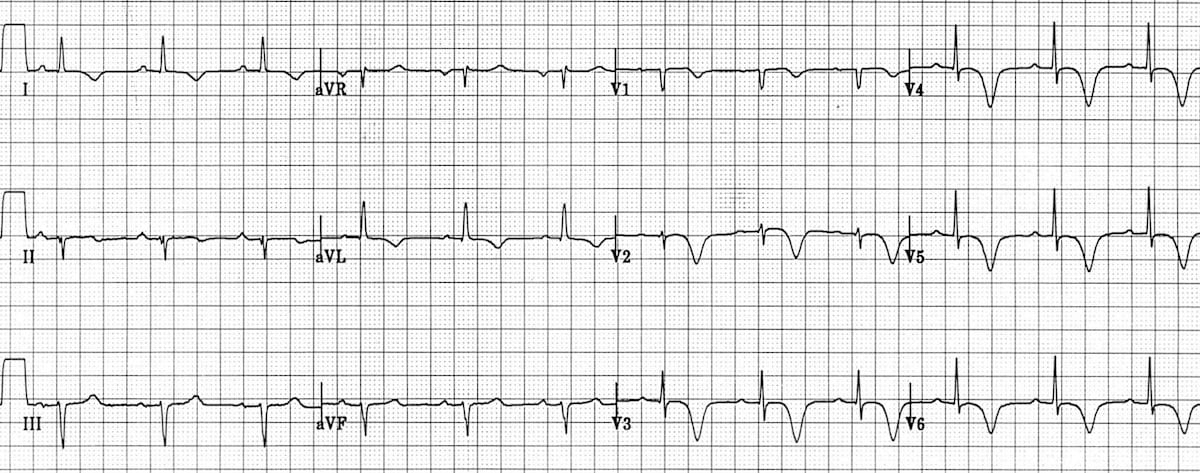
Figure 9. There are deep, symmetrical T wave inversions throughout the anterolateral leads
(V1-6, I, aVL) [6]
REFERENCES
- Danlel Krelder, MD, Jeremy Berberlan, MD (2019), STEMI Equivalents: Can’t-Miss patterns, Cardiology, https://www.emra.org/emresident/, access: 07/06/2020
- De Winter . RJ et al:A New ECG Sign of Proximal LAD Occlusion. N Engl J Med 359;19 www.nejm.org november 6, 2008
- De Zwaan C, Bär FW, Wellens HJ. Characteristic electrocardiographic pattern indicating a critical stenosis high in left anterior descending coronary artery in patients admitted because of impending myocardial infarction. Am Heart J. 1982 Apr;103(4 Pt 2):730-6. PMID 6121481
- Ed Burns (2019), De Winter T wave, ECG library, https://litfl.com/, access: 05/06/2020
- Kristian Thygesen, Fourth universal definition of myocardial infarction (2018), European Heart Journal (2019) 40, 237–269
- Mike Cadogan, Wellens Syndrome, ECG library, https://litfl.com/, access: 06/06/2020
- Omar Alassaf, MD, Mouayad Abdulghani, MD, Anas Musa, MD,and Muna AlJallaf, MD. Wellen’s SyndromeThe Life-Threatening Diagnosis. Circulation,Volume 140, Issue 22, 26 November 2019;, Pages 1851-1852
- Pinto J J et al. Tall upright T waves in the precordial leads. Circulation 1987;36(5):708-16
- Rhinehardt J, Brady WJ, Perron AD, Mattu A. Electrocardiographic manifestations of Wellens syndrome. Am J Emerg Med. 2002 Nov;20(7):638-43. PubMed PMID: 12442245.
- Tewelde S et al. Pitfalls in Electrocardiographic Diagnosis of Acute Coronary Syndrome in Low-Risk Chest Pain. The Western Journal of Emergency Medicine 18(4):601-606 · June 2017
- Verouden NJ, Koch KT, Peters RJ, Henriques JP, Baan J, van der Schaaf RJ, Vis MM, Tijssen JG, Piek JJ, Wellens HJ, Wilde AA, de Winter RJ. Persistent precordial “hyperacute” T-waves signify proximal left anterior descending artery occlusion. Heart. 2009 Oct;95(20):1701-6. [PMID 19620137]