 Hội Nội Tiết – Đái Tháo Đường Miền Trung Việt Nam Hội Nội Tiết – Đái Tháo Đường Miền Trung Việt Nam
EVALUATION OF DYSLIPIDEMIA AND ATHEROGENIC INDEX IN THE NEWLY DIAGNOSED PREDIABETIC SUBJECTS IN QUANG BINH PROVINCE
Lê Viet Hung+, Nguyen Hai Thuy*, Tran Huu Dang*,
Nguyen Hai Ngoc Minh**, Nguyen Thị Tra My +
Quang Binh Medical College,
* Hue University of Medicin and Pharmacy, ** Da Nang Family Hospital
DOI: 10.47122/vjde.2022.53.1
ABSTRACT
Dyslipidemia is associated with an increased risk of cardiovascular disease. Vascular complications emerge even in pre-diabetes [3]. Many studies have found that dyslipidemia commonly precedes the onset of type 2 diabetes and that this disorder resembles insulin resistance syndrome. Objectives: 1. Determine the rate of newly diagnosed prediabetes in the community in Quang Binh province; 2. Evaluate the dyslipidemia and atherogenic index in the newly diagnosed prediabetes . Methods: A cross-sectional and descriptive design. Employing a two-stage cluster sampling method, we recruited non-diabetic/pre-diabetic adults (ages range from 20 – 60 years) from Quang Binh province. Prediabetes and dyslipidemia were defined according to international guidelines. Results: Newly diagnosed prediabetes was detected in 35% of participants, and diabetes was 14.8% (p = 0.01) in 1206 study subjects. In the prediabetes group, there were 27.5% with high TC, 41.7% with high TG, 37.9% with high LDL-C levels, 41.8% with low HDL-C levels, and 47.5% high non-HDL-C levels. 9.6% of participants with prediabetes had a ratio of TG/HDL-C with the risk value, LDL-C/HDL-C (57.8%), and TC/HDL-C (41.4%). HbA1C level is significantly associated with HDL-C, non-HDL-C, TG, and LDL-C/HDL-C. Conclusion: Prevalence of prediabetes very high in population at Quang Binh Province. The dyslipidemia (high TG and low HDL-C levels) and abnormal atherogenic index (high Non HDL.C, high TC/HDL.C and high LDL.C/HDL.C) are also risk factors for prediabetic subjects in Central Vietnam .
Keywords: Prediabetes, Lipid Profile, Atherosclerotic index.
Main correspondence: Le Viet Hung
Submission date: 1th Dec 2022
Revised date: 15th Dec 2022
Acceptance date: 30th Dec 2022
Email: [email protected]
- INTRODUCTION
Prediabetes is defined as a non-diabetic level of hyperglycemia, it constitutes a pre-morbid state with an increased risk of progression to type 2 diabetes (T2DM). Dyslipidemia is associated with an increased risk of cardiovascular disease. Vascular complications emerge even in pre-diabetes [3]. Numerous studies have found that dyslipidemia commonly precedes the onset of type 2 diabetes and that this disorder resembles insulin resistance syndrome [6].
According to the Ministry of Health of Vietnam’s 2015 statistics, the rate of diabetes in the age group 30-69 is 5.8%; the rate of fasting glucose disorder (FGD) is 3.6% and tends to be younger. Only 31.1% of diabetes patients are diagnosed, and the majority are admitted to the hospital at the late stage. Only 28.9% of diabetics with hyperglycemia were managed in health care facilities [2]. Therefore, we conducted this study to determine the rate and evaluate the relationship between glycemic profile with lipid profile and atherosclerotic index in newly diagnosed prediabetíc subjects in Quang Binh Province
- METHODS
2.1. Research subjects: We recruited non-diabetic/pre-diabetic adults (ages range from 20 – 60 years) from Quang Binh province. The study was conducted from July 2021 to August 2022 (15 months).
2.2. Design: cross sectional, descriptive.
Sample size: 1200 people
Diagnotic Criteria: Diagnosing Prediabetes:
According to the Guidelines for diagnosis and treatment of diabetes by the Ministry of Health issued (July 16, 2020) and the American Diabetes Association-ADA 2021: Prediabetes was defined as HbA1c 5.7–6.4% (39–46 mmol/mol), impaired fasting glucose (IFG) (FPG=6.1–6.9 mmol/L).
Diagnosing Dyslipidemia. Dyslipidemia was defined as LDL-C ⩾ 3.4 mmol/L,
HDL-C <1.04 mmol/L for men and <1.3 mmol/L for women,
Total cholesterol (TC) ⩾ 5.2 mmol/L, Triglycerides (TG) ⩾ 1.7 mmol/L or treatment with lipid-lowering drugs with all lipid levels in the normal range [11], [12]:
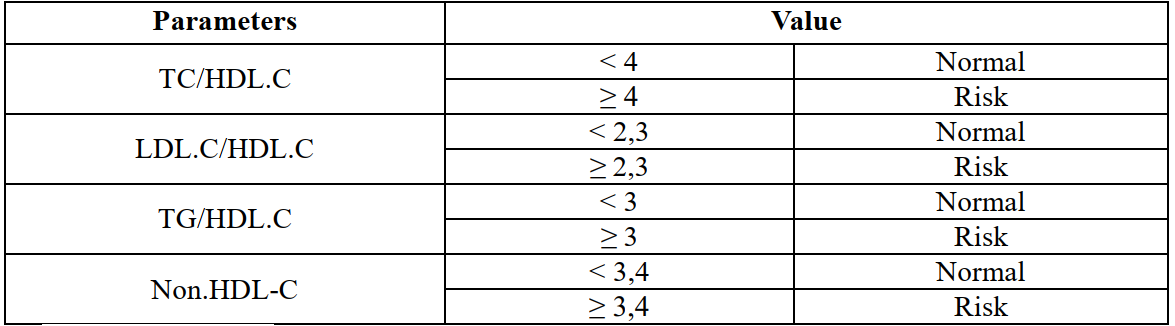
Atherogenic index of plasma (Table 2)
Table 1. American National Lipid Society Recommendations & NCEPATP III about dyslipidemia
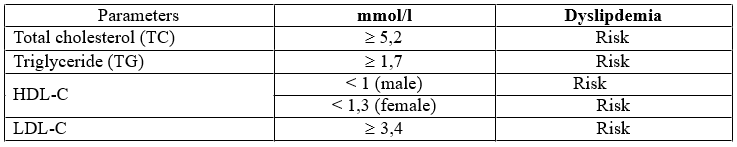
Table 2. Atherogenic index of plasma
Statistical analysis
The data are reported as mean, standard deviation, absolute number, and percentage. The statistical analysis was carried out using the chi-square test. A value of p < 0.05 was considered significant. All the data were run on SPSS software (IBM SPSS Statistics for Windows, Version 23.0.).
- RESULTS
3.1. Clinical Characteristics, Lipid Profile and atherosclerotic index in newly diagnosed Prediabetes
Table 3.1. Prevalance of newly diagnosed prediabetes
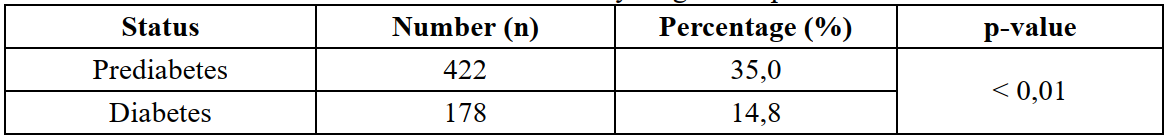

The newly diagnosed prediabetes was 422 patients (35%) and the newly diagnosed diabetes was 178 subjects (14.8% ) p < 0.01).
3.2. Lipid profile and Atherogenic index in Prediabetes
Table 3.2. Prevalance of dyslipidemia and Prediabetes.
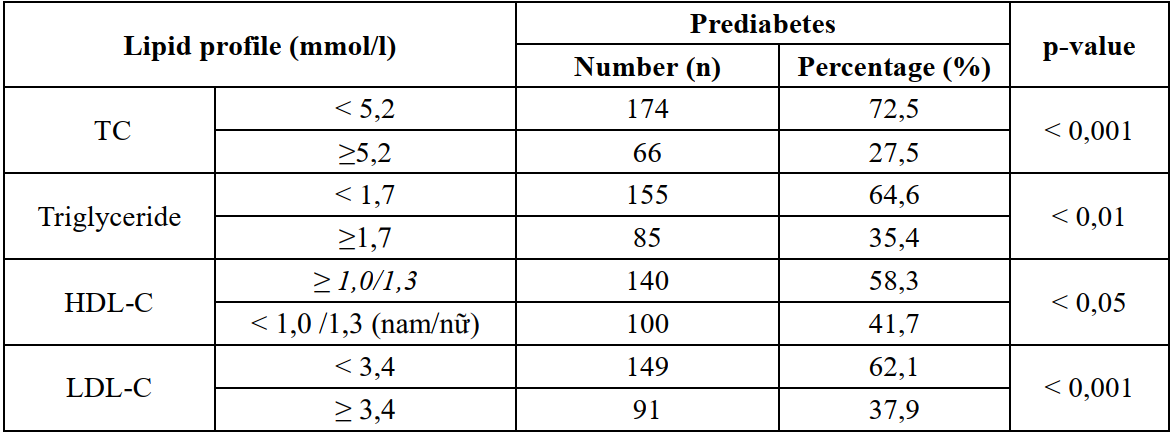
Prevalence of prediabetes with TC ≥ 5,2 mmol/l was 27.5% , with TG ≥1,7 mmol/l was 35,4 % , with LDL-C ≥ 3,4 mmol/l was 37.9% and with low HDL-C was 41.7 % .
Correlation between HbA1C and Fasting Glucose with lipid profile
There was correlation between HbA1C level with HDL.C level (r = 0.128, p = 0.048) and the correlation equation Y = 0.2035x + 2.4335; There was correlation between HbA1c with TG levels (r=0.133, p=0.040 and correlation equation Y= 0.4813x + 0.4157.
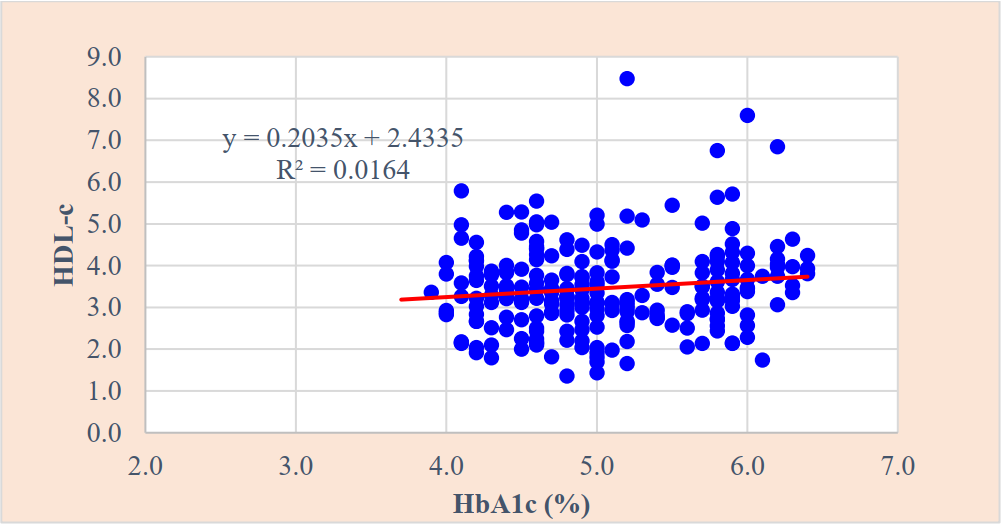
Figure 1. Correlation between HbA1c and HDL-C (r=0.128; p < 0.05) Linear regression correlation equation y = 0.2035x + 2.4335;
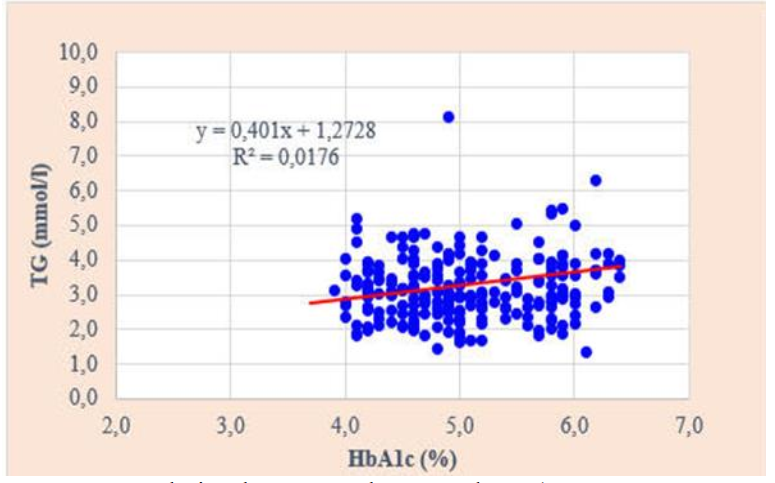
Figure 2. Correlation between HbA1c and TG (r = 0.133, p = 0.040) Linear regression correlation equation Y = 0.401x+12728
Table 3.3. Atherogenic index in prediabetic subjects
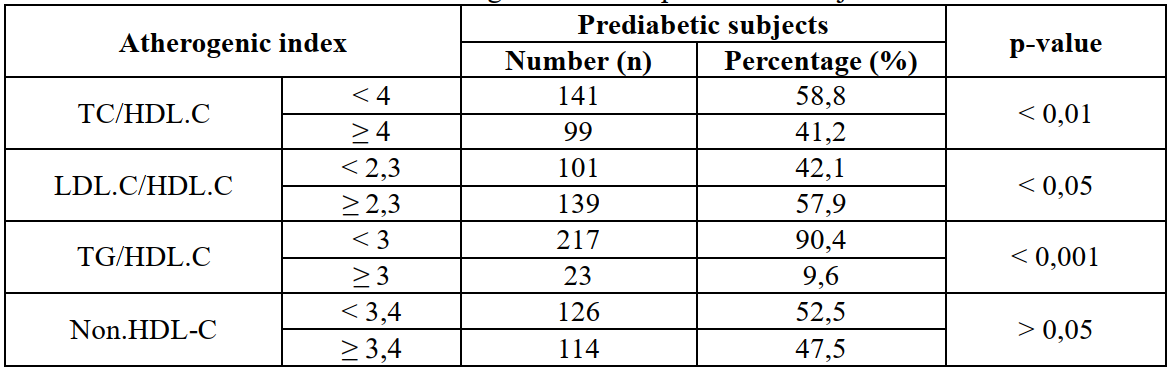
Prevalence of prediabetes with LDL.C/HDL.C ≥ 2,3 was 57.9 %, with Non-HDL.C ≥ 3,4 mmol/l was 47.5%, with TC/HDL.C ≥ 4 was 41.2 %, and TG/HDL-C was 9.6%.
Correlation between glycemic profile with atherosclerotic index in newly diagnosed prediabetes
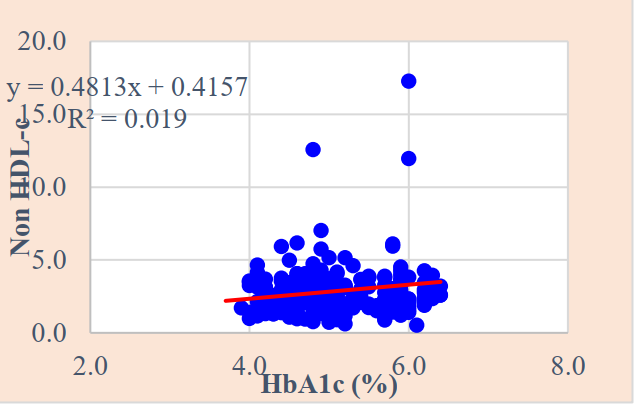
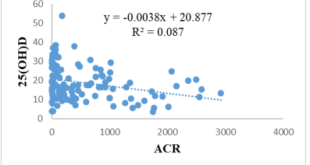
Figure 3. Correlation between HbA1c and Non HDL-C (r=0.138; p < 0.05) Linear regression correlation equation y = 0.4813x + 0.4157
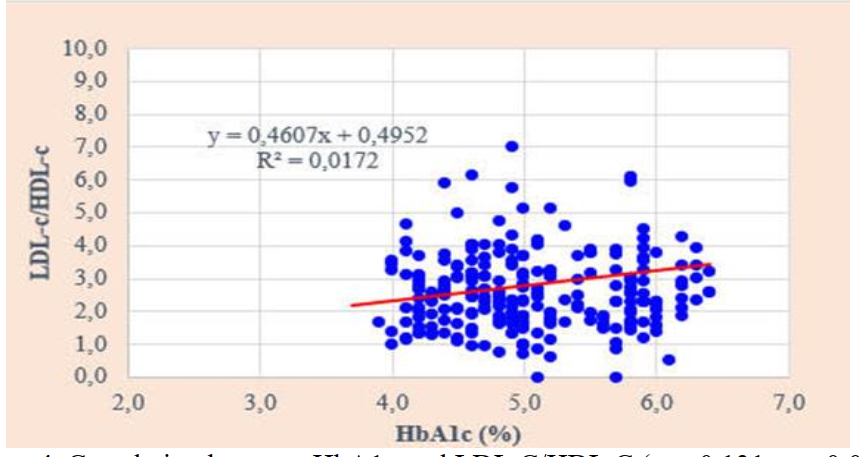
Figure 4. Correlation between HbA1c and LDL.C/HDL.C ( r = 0.131, p = 0.041 ) Linear regression correlation equation Y=0.4607x+0.4952
- DISCUSSION
In our study, the prevalence of newly diagnosed pre-diabetes was 35%, and the subjects had the following lipid profile and atherosclerotic index.
4.1. Dyslipidemia in newly diagnosed prediabetic subjects:
Dyslipidemia is a disorder and/or increased levels of lipid components in the blood, resulting in the formation of atherosclerotic plaques that cause thrombosis and increase the risk of cardiovascular complications, stroke, and other vascular complications. Research of Le Van An recorded the risk factors for increased cardiovascular events in patients with diabetes, and dyslipidemia accounted for 62.28%.
We found that: there was 27.5% of high total cholesterol (TC); 41.7% of high triglyceride, 37.9% of high LDL-C ; 41.8% of low HDL-C in prediabetic group. There was no significant difference in the rate of prediabetes between the groups with high non-HDL-C (47.5%) and those without (51.9%), with p > 0.05.
The majority of domestic and international authors’ research has found that subjects with dyslipidemia are at high risk of developing prediabetes or diabetes. Two of the four components of the metabolic syndrome are high triglycerides and low HDL-C [6], [11].
Similar to our study results, Phan Long Nhon (2012) studied risk factors in subjects > 30 years old, showing a high prevalence of dyslipidemia of 14.28% compared to the group without high blood lipids (85.72%), and the high TG group was 17.46% versus 82.54% with no increase, high LDL-C was 6.77% vs 93.23% without, and low HDL-C was 4.23% versus 95.77% [5].
Similar to our findings, dyslipidemia primarily caused TG increase; the TG increase rate was 41.7%, and low HDL-C was 41.8% (p < 0.05). According to Ho Thi Thuy Vuong et al. (2009), the TC group increased 13.1% more than the normal group (p 0.01), and the TG group increased 18.55% more than the normal group (p < 0.01). The reduced HDL-C group was 9.8% higher than the normal HDL-C group (p > 0.05); the LDL-C group increased by 9.7% higher than the normal group (p < 0.05). Le Anh Tuan (2010) discovered a correlation between the FPG, and the lipid profile such as cholesterol, TG, LDL-C, and HDL-C (p < 0.01) when studying pre-diabetes over 45 years old in Da Nang city [7] [8].
The Asians in general and Vietnamese in particular have the habit of eating a lot of starch, especially white rice, which often has a high glycemic index and drinks a lot of alcohol containing fatty acids. Both of these increase triglycerides. This explains why TG increased in this group. This is a consequence of pancreatic beta cell dysfunction in the pre-diabetic stage.
The study of dyslipidemia in patients with impaired glucose tolerance (IGT), Heinz Drexel found that there was a difference between them and normal people with IGT. The mean values of triglycerides, HDL between these two groups of subjects were (1.56 ± 0.93 / 1.74 ± 0.99; and 1,350.39 / 1.24 ± 0.34) (p < 0.001) [10].
Most domestic and international previous studies investigated the association of dyslipidemia and prediabetes, and the presence of dyslipidemia has been reported to be associated with increased risk of progression of prediabetes to full type 2 diabetes (T2DM). In particular, high triglycerides and low HDL-C are two of the four components of the metabolic syndrome. Thus, in the pre-diabetes stage, there were effects of dyslipidemia such as high total cholesterol, high TG, high LDL-C, and low HDL-C. In particular, TG is a classic factor for insulin resistance that contributes to hyperglycemia. Thus, biochemical parameters of lipid profile, TG and HDL-C should be considered as important predictive marker factors in the screening of prediabetes or diabetes for high-risk subjects in the community.
4.2. Atherogenic indices in newly diagnosed prediabetes.
Because the majority of patients with pre-diabetes have had specific or non-specific regimens for dyslipidemia management. Therefore, it is possible to change the concentration of blood lipid components but not the atherogenic indices. Therefore, atherogenic index is now a valuable biological indicator in the assessment of dyslipidemia compared with blood lipid profile.
In our study the prevalence of pre-diabetes with an atherogenic index of pathological TG/HDL-C ratio.was 9.6%,
Prevalence of pre-diabetes with a pathological LDL-C/HDL-C atherogenic index was 57.8%;
The prevalence of pre-diabetes with an atherogenic index of pathological TC/HDL-C ratio was 41.4%, .
There is a relationship between HbA1c and HDL-C (r = 0.128, p = 0.048, and the correlation equation Y = 0.2035x + 2.4335);
There is a relationship between HbA1c and non-HDL-C (r = 0.138, p = 0.033, and the correlation equation Y = 0.4813x + 0.4157);
There is a relationship between HbA1c and TG (r = 0.133, p = 0.040, and the correlation equation Y = 0.401x + 12728);
There is a relationship between HbA1c and LDL-C/HDL-C (r = 0.131, p = 0.041, and correlation equation Y = 0.4607x + 0.4952).
- CONCLUSSION
The prevalence of newly diagnosed pre-diabetes in Quang Binh province in 2022 was 35 % (422/1206), including 76.8% of females and 23.2% of males.
Lipid Profile and glycemic profile Prediabetes was detected in 27.5% of high
TC, high of TG (41.7%), high LDL-C (37.9%), low HDL-C (41.8%), and high non- HDL-C (47.5%).
HbA1C were associated with HDL.C (r = -0.128, p = 0.048) and the correlation equation Y = 0.2035x + 2.4335;
HbA1c were associated with TG (r=0.133, p=0.040 and correlation equation Y= 0.4813x + 0.4157
Atherosclerotic index and Glycemic Profile
The prevalence of pre-diabetes with an atherogenic index of high TG/HDL-C ratio.was 9.6%,
Prevalence of pre-diabetes with a pathological LDL-C/HDL-C atherogenic index was 57.8%;
The prevalence of pre-diabetes with an atherogenic index of high TC/HDL-C ratio was 41.4%, .
There is a relationship between HbA1c and HDL-C (r = 0.128, p = 0.048, and the correlation equation Y = 0.2035x + 2.4335);
There is a relationship between HbA1c and non-HDL-C (r = 0.138, p = 0.033, and the correlation equation Y = 0.4813x + 0.4157);
There is a relationship between HbA1c and TG (r = 0.133, p = 0.040, and the correlation equation Y = 0.401x + 12728);
There is a relationship between HbA1c and LDL-C/HDL-C (r = 0.131, p = 0.041, and correlation equation Y = 0.4607x + 0.4952).
Prevalence of prediabetes very high in population at Quang Binh Province. The dyslipidemia (high TG and low HDL-C levels) and abnormal atherogenic index (high Non HDL.C, high TC/HDL.C and high LDL.C/HDL.C) are also risk factors for prediabetic subjects in Central Vietnam
REFERENCES
- Bộ Y tế (2020), Hướng dẫn chẩn đoán và điều trị tiền đái tháo đường, Quyết định số 3087/QĐ-BYT ngày 16 tháng 07 năm 2020 của Bộ trưởng Bộ Y tế, Hà Nội.
- Cổng thông tin điện tử Bộ Y tế-Cục Y tế dự phòng (2015), Công bố kết quả điều tra quốc gia yếu tố nguy cơ bệnh không lây nhiễm năm 2015. https://vncdc.gov.vn/cong-bo-ket-qua-dieu-tra-quoc-gia-yeu-to-nguy-co-benh-khong-lay-nhiem-nam-2015-nd14421.html
- Trương Xuân Hùng (2021), “Nghiên cứu tiền Đái tháo đường trên đối tượng cán bộ chiến sỹ”, Tạp chí Nội tiết & Đái tháo đường, số 46 + 47, tr.139-148.
- Trần Thừa Nguyên, Trần Hữu Dàng, Lý Thị Thu Vân (2012), “ Đánh giá tỷ lệ rối loạn lipid máu ở bệnh nhân tiền đái tháo đường bị nhồi máu não”, Kỷ yếu toàn văn các đề tài khoa học Hội Nội tiết -Đái tháo đường-Rối loạn chuyển hoá Miền Trung mở rộng lần thứ VIII, Tạp chí Nội tiết-Đái tháo đường, Số 8/2012, tr.422.
- Phan Long Nhơn, Đặng Xuân Hào, Hoàng Thị Kim Nhung (2012), “Nghiên cứu thực trạng tiền đái tháo đường chưa được chẩn đoán tại BVĐKKV Bồng Sơn Bình Định”, Tạp chí Nội tiết – Đái tháo đường, số 6, tr.22-27.
- Nguyễn Hải Thuỷ (2013), “ Tài liệu cập nhật đái tháo đường, Viện Nội tiết trung Ương-BV Đại học Y Dược Huế, tr.360
- Lê Anh Tuấn (2010), “Nghiên cứu tình hình tiền đái tháo đường và các yếu tố liên quan ở người trên 45 tuổi đến khám tại bệnh viện quận Hải Châu-Đà Nẵng”, Luận án chuyên khoa cấp II, ĐH Y Dược Huế.
- Hồ Thị Thuỳ Vương, Nguyễn Hải Thuỷ (2009), “Nghiên cứu tỷ lệ mỡ cơ thể (BFP) và mức mỡ nội tạng (VFL) trong giai đoạn tiền đái tháo đường”, Tạp chí Nội khoa, Kỷ yếu toàn văn các đề tài khoa học đại hội và hội nghị nội khoa toàn quốc lần thứ VI, số 1/2009, tr. 444-453.
- American Diabetes Association (2021), “Classification and Diagnosis of Diabetes: Standards of Medical Care in Diabetes-2021”, Diabetes Care, Vol. 44 (1), January 2021, pp. S15–S33.
- Drexel H., Aczel S., Marte T. (2005), “Is atherosclerosis in diabetes and impaired fasting glucose driven by elevated LDL cholesterol or by decresaed HDL cholesterol”, Diabetes care, volume 28(1), January 2005, pp. 108-114.
- International Diabetes Federation (2006), “ The IDF consensus worldwide definition of the Metabolic syndrome”, Report of a IDF consultation, pp.10-11.
- Jacobson, T.A., Case, C.C., Roberts, S. et al (2004), “Characteristics of US adults with the metabolic syndrome and therapeutic implications”, Diabetes, Obesity and Metabolism, 6, 2004, pp.353– 362