PREVALENCE OF PREDIABETES AND CARDIAC RISK FACTORS IN THE OUTPATIENT DEPARTMENT OF BACH MAI HOSPITAL
Do Trung Quan
Hanoi Medical University
SUMMARY
Objective: 1/ To estimate the prevalence of prediabetes in Outpatient department of Bach Mai hospital. 2/ to assess some cardiac risk factors in these patients. Subjects and Method: a descriptive study was done in 1054 healthy Vietnamese people from 30 to 69 years old who had their health routinely checked at the Outpatient Department of Bach Mai hospital from February to October 2012.Results: The prevalence of prediabetes is 38% in which the male to female ratio is 1:2.2. The prevalence of prediabetes increases with age which is lowest in the group of 30 – 39 years and highest in the group of 60 – 69 years. Compared to the healthy ones, the prevalence of prediabetes in people with BMI ³ 23 was 1,3 times higher, in hypertensive patients was 3.8 times higher, and in patients with dyslipidemia was 3.8 times higher.Conclusion: The prevalence of prediabetes in people form 30 to 69 years of age is 38%. There is a relationship between the risk of prediabetes and age, hypertension, dyslipidemia, BMI. There is no relationship between the risk of prediabetes and sex.
Main correspondence:Do Trung Quan
Submission date: 8 Feb 2017
Revised date: 20 Feb 2017
Acceptance date: 15Mar 2017
I. INTRODUCTION
Prediabetes is a condition in which the blood glucose levels are higher than normal , but not high enough to be classified as type 2 diabetes. Prediabetes includes: impaired glucose tolerance and impaired fassting glucose [1].
There have been many studies in the rate of prediabetes. According to National Diabetes Fact Sheet, in US there were 79 million people having prediabetes (25,4% of population) in 2011[2]. According to NHS, in Singapore, there were 12% of population from 18 to 69 years old having prediabetes in 2004[3].
There have been many studies of the prevalence of prediabetes. The National Diabetes Fact Sheet showed that there were 79 millions people in USA with prediabetes (25,4% of population). In Singapore, NHS showed that there were 12% of population in the age group of 18 – 69 years having prediabetes in 2004.
In Viet Nam, there haven’t been many study of prediabetes. However, they estimate the number of patients with prediabetes are 12% of population and almost all of them will progress into diabetes over next 10 years. People with prediabetes who are not diagnosed early will progress into diabetes , and result in a high cost of treatment and the risk of many complications such as eye complication, kidney failure, stroke, myocardial ischemic, hypertesion, neurology complication, amputation. [4]. We can prevent the progression into diabetes from prediabetes by changing life style, diet and medication. So, we carry out this study with two objectives: 1/ to estimate the prevalence of prediabetes in out – patient department of Bach Mai hospital. 2/ to assess some risk factors in prediabetes.
II. MATERIALS AND METHODS
1.Patients:
1054 healthy people, aged between 30 – 69. Participants were diagnosed prediabetes according to ADA 2003 standard when they had at least one of two following criterias: 1/ Fasting blood glucose level is from 5,6 mmol/l to < 7 mmol/l; 2/ Blood glucose level 2 hour after oral glucose tolerance test is from 7,8 mmol/l to < 11,1 mmol/l.
2. Study procedure:
2.1. Method: descritive cross-sectional study
2.2. Variables: age, sex, BMI, waist measurements, blood pressure, fasting blood glucose, blood glucose 2 hour after glucose tolerance test.
2.3. Statistics: Data analyses were performed using statistical analysis sofware SPSS 16.0
III. RESULTS
1.Characteristic of patients in our study:
1.1. Age
Table 1.1. Distribution of participants into age groups
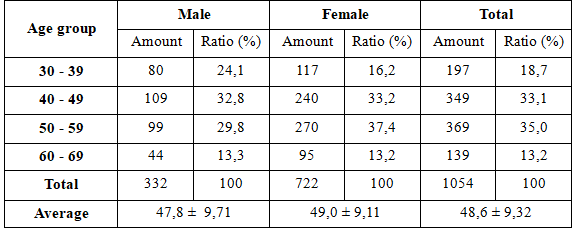 The average age in our study is 48,6 ± 9,32, the lowesr age is 30 years old and highest age is 69 years old. The average age in male is 47,8 ± 9,71, in female is 49,0 ± 9,11. The age group of 30 – 39 years is 18,7% of participants, the age group of 40 – 49 is 33,1% of participants, the age group of 50 – 59 years is 35%, and the age group of 60 – 69 years is 13,2%.
1.2. Sex
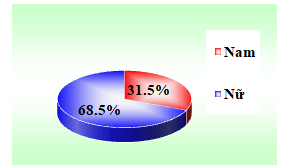
In 1054 participants, there are 332 males (31,5%) and 722 females (68,5%). The rate of female patient is higher than male patient.
Figure 1.1. Distribution of participants into sex
2. The prevalence of prediabetes in our study
Figure 1.3. The prevalence of prediabetes

3. Risk factors of prediabetes
3.1. Prediabetes and sex
Table 1.1. Prediabetes, diabetes and sex

The prevalence of prediabetes and diabetes in our study is 38% and 9%. The rate of prediabetes and diabetes in male is 38% and 9,6%, in female is 38% and 8,7%. There is no difference between two sex in the prevalence of prediabetes (p > 0,05).
3.2. Prediabetes and age
Figure 1.1. The blood glucose level and age

The rate of prediabetes and diabetes increase along with age. This rate is lowest in the age group of 30 – 39 years (prediabetes: 24,4%; diabetes: 3%), and highest in the age group of 60 – 69 years (prediabetes: 49,6%; diabetes: 14,4%). There is a difference in the rate of prediabetes between each age group (p < 0,05).
3.3. Prediabetes and BMI
Table 1.2. Prediabetes, diabetes and BMI
 The prevalence of prediabetes and diabetes in the group of patients with normal BMI is 36,4% and 6,8%; this prevalence in group of patients with high BMI is 40,1$ and 12,2%. The rate of prediabetes in the group of patients with BMI over 23 is 1,3 times higher than that in the group of patients with normal BMI. There is a difference in the rate of prediabetes between two group of patients, p < n0,05, 95% CI = [1,008 ; 1,701].
3.4. Prediabetes and hypertension
Table 1.3. Prediabetes, diabetes and hypertension

The prevalence of prediabetes and diabetes in the group of patients with normal blood pressure is 33,6% and 6,6%. This prevalence in group of patients with hypertension is 55,5% and 18,7%. The rate of prediabetes in the group of patients with hypertension is 3,8 times higher than that in the group of patients with normal blood pressure. There is a difference in the rate of prediabetes between two groups, p < 0,001, OR = 3,82, 95% CI = [2,681 ; 5,443].
3.5. Prediabetes and dyslipidemia
Table 1.4. Prediabetes, diabetes and dyslipidemia
 The prevalence of prediabetes and diabetes in the group of patients with dyslipidemia is 47,2% and 12,7%. This prevalence in the group of patients with normal lipid levels is 22,9% and 3%. There is a difference in the rate of prediabetes between two groups, p < 0,001.
The rate of prediabetes in the group of patients with dyslipidemia is 3,8 times higher than that in the group of patients with normal lipid levels, p < 0,001, 95% CI = [2,871 ; 5,088].
IV. DISCUSSION
4.1. Characteristic of participants
4.1.1. Age and sex: There are 1054 participants in our study. The results show that the average age is 48,6 ± 9,32, the lowest age is 30 and the highest age is 69. The average age of male is 47,8 ± 9,71, of female is 49,0 ± 9,11. The age group of 30 – 39 years is 18,7%, the age group of 40 – 49 years is 33,1%, the age group of 50 – 59 years is 35% and the age group of 60 – 69 years is 13,2%.
In our study, male is 31,5%, female is 68,5%. In 400 patients with prediabetes, female is 68,5%. The ratio of prediabetes of male and female is 1/ 2,2. In Cao My Phuong’s study in 143 patients with prediabetes in Tra Vinh province, the ratio male/femal is 1/ 1,8. This ratio in Diabcare – Asia (1998) and Diabcare Viet Nam (1998 – 2003) is 1/ 2.
The question is that why the rate of prediabetes in female is higher than in male? According to us, the reason is the rate of overweight and obesity in female is higher than in male. Morever, the relationship between the women over 45 years old and menopause makes the risk of dyslipidemia and prediabetes higher.
4.2. The prevalence of prediabetes
4.2.1. Fasting blood glucose: In 1054 participants in our study, there is 65,5% of patients with normal fasting blood glucose, 30% of patients with impaired fasting glucose and 45% of patients with diabetes. In male, these rates are 60,9%, 33,4%, 5,7% and in female these rate are 67,7%, 28,4%, 3,9%.
In Hoang Kim Uoc’s study in Thai Nguyen (2006) in the patients from 25 to 69 years old, there is 5,3% of patients with type 2 diabetes and 22,8% patients with impaired fassting glucose.
4.2.1. Blood glucose 2 hours after glucose tolerance test:
In this study, we carry out glucose tolerance test in all of participants. The table 3.9 show that there is 29,5% of patients with prediabetes and 8% of patients with diabetes. In male, this rate is 24,1% and 9%; in female, this rate is 32% and 7,5%.
In 400 patients with prediabetes, there are 98 patients with only impaired fasting glucose (24,5%), 128 patients with only impaired gluocse tolerance (32%), 174 patients with both of impaired fasting glucose and impaired glucose tolerance (43,5%).
The result of glucose tolerance test in 316 patients with impaired fasting glucose show that there are 55,1% of patients with prediabetes, 13,9% of patients with diabetes and 31% normal patients.
In study of Duong Bich Thuy in 247 patients with impaired fasting glucose after glucose tolerance test, there are 38,9% of patients with impaired glucose tolerance, 22,7% of patients with type 2 diabetes and 38,4% of patients with normal glucose tolerance.
4.3. The risks of prediabetes
4.3.1. Age
In our study, the risk of prediabetes and diabetes increase along with age. Base on fasting blood glucose, the rate of prediabetes in the age group of 30 – 39 years, 40 – 49 years, 50 – 59 years, 60 – 69 years is 18,8%; 23,2%; 38,7%, and 39,6%. Base on the results of glucose tolerance test, the rate of prediabetes increases along with age. The result shows that the higher the age is, the higher the rate of prediabetes is. The study of Nguyen Hai Nam in 811 patients from 30 to 69 years old in Hue shows that the rate of dibates and prediabetes in patients in the age group over 45 (20,6%) is higher than that in patinets in the age group under 45 (9,1%).
4.3.2 Sex
In our study, the table 1.1 shows that the rate of prediabetes and diabetes in male is 38% and 9,6%, this rate in female is 38% and 8,7%; there is no different between the two groups (p > 0,05).
The study of Le Quang Minh (Bac Kan), Nguyen Van Nam (Hue), Pham Thi Hong Hoa (Ha Noi) and many other researchers also shows that there is no different in the rate of prediabtes and diabetes between two sexs.
4.3.3. BMI
According to WHO, the strongest risk of diabetes and impaired glucose tolerance is obesity. When they evaluate the relationship between BMI and the risk of prediabetes and diabetes , they find that if BMI is over 23 the risk of prediabetes increase. According to Nguyen Thi Ngoc Huyen (2005), the risk of prediabetes in overweight and obese patients is 1,67 times higher thanthat in normal patients (OR = 1,67, 95% CI = [1 ; 2,8], p < 0,05).
In our study, the risk of prediabetes in patients with BMI over 23 is 1,3 times higher than that in patients with normal BMI. There is a different between two groups with p < 0,05, 95% CI = [1,008 ; 1,701]. Our study show that the risk of prediabetes in overweight and obese patients increase as other researchs.
The study of Le Minh Su in Thanh Hoa shows that the rate of impaired glucose tolerance in patients with BMI under 23 is 3,7%; in patients with BMI from 23 to 25 is 7,95% and in patients with BMI over 25 is 11,1%, p < 0,05. According to Hoang Kim Uoc, Phan Huong Duong, the rate of impaired glucose tolerance in patients with BMI under 23 is 7,8%, inpatients with BMI from 23 to 29,9 is 16,1%, in patients with BMI over 30 is 13,5%. There is a strong relationship between obesity and impaired glucose tolerance.
4.3.4. Hypertension
In our study, the rate of prediabetes in patients with normal blood pressure is 33,6% and the rate of diabetes in this group is 6,6%. In patients with hypertension, the rate of prediabetes and diabetes is 55,5% and 18,7%. The rate of prediabetes in patients with hypertension is 3,8 times higher than that in patients with normal blood pressure, p < 0,001, OR = 3,820, 95% CI = [ 2,681 ; 5,443]. The risk of diabetes in patients with hypertension is 6,5 times higher than that in patients with normal blood pressure. We also find that the rate of hypertension in patients with normal blood glucose is 9,7%, and this rate increases to 29% in patients with prediabetes and to 41,1% in patients with diabetes.
The study of Nguyen Thi Ngoc Huyen shows that the risk of prediabetes and diabetes in patients with hypertension is 2,5 times and 3,8 times higher than that in patients with normal blood pressure [6].
4.3.5. Prediabetes, diabetes and dyslipidemia
The rate of prediabetes, and diabetes in patients with dyslipidemia is 47,2% and 12,7%; this rate in patients with normal lipid levels is 22,9% and 3%. There is a different in the rate of predibates and diabetes between two groups (p< 0,001).
V. CONCLUSION
– The rate of prediabetes in our study is 38%
– Age: the higher the age is, the higher the risk of prediabetes and diabetes is
– Sex: There is no different in the rate of prediabetes and diabetes between two sexs.
– Hypertension: There is a strong relationship between hypertension and prediabetes, diabetes. The risk of prediabetes in patients with hypertension is 3,8 times higher than that in patients with normal blood pressure
– The risk of prediabetes in patients with dyslipidemia is 3,8 times higher than that in patients with normal lipid levels
– BMI: There is a strong relationship between BMI and the risk of prediabetes. The risk of prediabetes in patients with BMI over 23 is 1,3 times higher than that in patients with BMI under 23
REFERENCES
- National Diabetes Fact Sheet (2011): “Fast facts on diabetes”, pp.1. ‘
- National Health Survey (2004), pp. 19.
- Alberti KG, Genuth S, Bennett P et al (2003): “Follow-up report on the diagnosis of diabetes mellitus”, Diabetes Care, 26, pp. 3160.
- IDI & WPRO (2000): “The Asia Pacific perspective redefining obesity and its treatment”, Health communication Australia, pp. 8 – 55.
- Amanda I.Adler M, Richard J.Stenven, Andrrew Neil et al (2002), “UKPDS 59: Hyperglycemia and Other Potentially Modifiable Risk Factors for Peripheral Vascular Disease in typ 2 diabetes”, Diabetes Care: p. 894-899.
- Elizabeth Selvin TPE, (2004), “ Prevalence of and Risk Factors for Peripheral Arterial Disease in the United States: Results From the National Health and Nutrition Examination Survey, 1999-2000”, Circulation, 110, p.738-743.
- Beks PJ MA, de Neeling JN, de Vries H, Bouter LM, Heine RJ (1995), “ Peripheral arterial disease in relation to glycaemic level in an elderly Caucasian population: the Hoorn study”, Diabetologia 38, p. 86-96.
- International Diabetes Federation (2015), “IDF Diabetes Atlas, 7 ed. Brussels, Belgium: International Diabetes Federation.“.
- Alberti KG và các cộng sự.(2007), ” a consensus on Type 2 diabetes prevention.“, Diabet Med. 24, tr. 451-63.
- Tuomilehto J và Schwarz PE (2010), “Primary prevention of type 2 diabetes is advancing towards the mature stage in Europe. “, Horm Metab Res. 42((suppl 1)), tr. S1-2.
 Hội Nội Tiết – Đái Tháo Đường Miền Trung Việt Nam Hội Nội Tiết – Đái Tháo Đường Miền Trung Việt Nam
