 Hội Nội Tiết – Đái Tháo Đường Miền Trung Việt Nam Hội Nội Tiết – Đái Tháo Đường Miền Trung Việt Nam
THE STUDY OF CORRELATION BETWEEN NEUROCOGNITIVE DISORDER AND BRAIN LESIONS ON MRI AND DIABETES RISK FACTORSIN TYPE 2 DIABETIC PATIENTS
Nguyen Van Vy Hau, Nguyen Hai Thuy
Hue University of Medicine and Pharmacy
ABSTRACT
Background: Exact mechanisms underlying cognitive dysfunction in diabetes mellitus (DM) remain unclear. Imaging studiesof the brain could help to identify possible structural brain lesions underlying cognitive dysfunction.Objective:1. To evaluate neurocognitive impairment by MMSE and MoCa neuropsychological with risk factors. 2. To determine the correlation between neurocognitive impairment and brain lesions on magnetic resonance imaging (MRI), i.e. periventricular hyperintensities (PVH), deep white matter lesions (DWML), medial temporal lobe atrophy (MTA), hyppothlamus volume.Methods: 50 patients with type 2 DM (mean age 63.2± 12.8 years, mean duration 13.8 ± 10.8 years) were included and underwent an extensive neuropsychological test and a brain MRI.Results: Age and duration of DM were significantly associated with cognitive dysfunction by MMSE and MoCa (p < 0.001). HbA1c and glucose level, cholesterol, LDL.c., and triglycerid were significantly associated with nerocognitive impairment. Normal neurocognitive group, mild neurocognitive group and dementia group have a progressively decrease in hypothalamus volume (2.78 ± 0.95; 1.91 ± 0.38; 1.61 ± 0.38; p < 0.001, repectively), an increase in lateral ventricles volume (2.78 ± 1.13; 2.89 ± 1.36; 3.66 ± 1.24 ( p< 0.001, respectively. 100% patients in dementia group, 75% in vas-dementia group, and 45,45% in NMD group have injured cerebral infarction defect. Periventricular and subcortical white matter lesions (WMLs) and subcortical atrophy were significantly associated with neurocognitive impairment.Conclusion: The neurocognitive impairment in the type 2 diabetes were significantly associated with decreased hypothalamus and increased lateral ventriclesvolume, with cerebral infarction defect, periventricular and subcortical white matter lesion (WMLs) and subcortical atrophy. The structure and function of brain have changed from mild neurocognitive impairment to progressive major dementia.
Main correspondence:Nguyen Van Vi Hau
Submission date: 9 Feb 2017
Revised date: 21 Feb 2017
Acceptance date: 15Mar 2017
I. INTRODUCTION
Diabetes is a complex metabolic disease, not contagious, and cause severe complications to agencies the body such as heart attack, kidney failure, vision loss, memory impairment, diabetic foot, … This is the cause of death ranks third after cancer and heart disease. Diabetes mellitus (DM) is associated with slowly progressive changes in the brain, a complication that is referred to as diabetic encephalopathy (DE). DE is a term that encompasses functional impairment of cognition, cerebral signal conduction, neurotransmission and synaptic plasticity, and underlying structural pathology associated with diabetes.
Not many people have knowledge about the risk and complications of diabetes, especially the little know complications neurocognitive disorder with symptoms such as memory loss (verbal memory, memory images, memories of work, short-term memory and long term memory), loss of attention, impaired information processing speed, reduced ability to speak fluently, reducing the daily living activities , personality changes, depression, … long-term risk of progressing to dementia if not treated promptly. In Vietnam, the percentage of patients with diabetes, including type 2 diabetes have a state of depression, memory loss and Alzheimer’s expression but also increasingly not interested in fair treatment . Causes and risk factors pathogenesis unclear, diagnostic methods, treatment and prevention of the risk of neurocognitive disorder , dementia has not been determined, haven’t many studies to compare the relationship between dementia and the risk factors in patients with type 2 diabetes. Stemming from the above issues, we conducted this study aims topics: 1.To evaluate neurocognitive disorder (NMD) by MMSE and MoCa neuropsychological with risk factors. 2. Correlations were studied between NMD and MRI
1.Patients and methods
1.1. Selection criteria for Patients
– >50 age, irrespective of gender, ethnicity, occupation.Educational background: from primary school or higher (with literacy).Criteria for type 2 diabetes diagnostic according to the ADA 2015, update ADA 2016. These patients were examined by the cognitive assessment scale: MMSE and MoCA.Stratified neurocognitive disorder by DSM 5. Brain MRI
2.2. Diabetic criteria ADA in 2015 [20]
- FPG ≥ 7 mmol/l- 2h-PG≥ 11.1 mmol/l, during OGTT 75mg- Random glucose > 11.1 mmol/l in persons with hyperglycemia or hyperglycemic crisis- HbA1c ≥ 6.5%.
2.3. Exclusion criteria
Not included in the study of objects:
Alcoholism.The pre-existing nerve damage.The mental illness, neurological disorders lead to mental awareness abnormality. Using sedatives, antipsychotic, sedating drug, addictive. Uncooperative behavior.
2.Methods
2.1. Research design. Cross-Sectional Research of 50 diabetic Patients
2.2. Data collection methods
– The data collection was carried out according to the sequence of steps:
– Step 1: Collecting the patient’s information including medical history, risk factors, understanding of diabetes and anthropometric indices (BMI, waist circumference) …
– Step 2: Assessment the neurocognitive by MMSE and MoCA scales and stratified by diagnostic scale DSM 5
– Step 3: additional tests: fasting glucose, HbA1c, lipid profiles liver enzymes, kidney function.
– Step 4: evaluation by MRI
2.3. The study parameters
– Age, gender, blood pressure, waist circumference, body weight, height and BMI.
– A history of diabetes and treatment, history of hypertension, diabetes history of the family
– Blood sugar, blood lipids,
– MMSE and MoCA
Assess the level of neurocognitive through MMSE scale:
≥ 24 points: normal.
19-24 points: mild cognitive impairment.
14-19 points: moderate cognitive impairment.
0-13 points: severe cognitive impairment
Assess the level of neurocognitive disorder via MoCA scale:
≥ 26 points: normal.
<26 points: neurocognitive disorder
Assess the level of awareness achieved when: MoCA ≥ 26 points.
3. Results and discusstions
3.1. The degree of neurocognitive disorder of subjects through MMSE scale
Table 3.1. The degree of neurocognitive disorder by MMSE
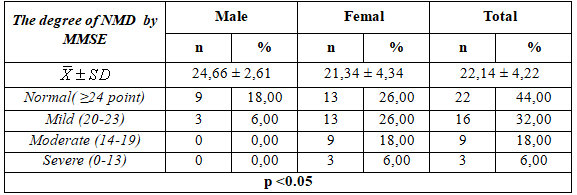 – Mean MMSE point off is 14 ± 4.22, The mean MMSE is higher in male than female (24.66 ± 2.61 vs21.34 ± 4.34 point).
– 44,0% subjets without neurocognitive disorder and 6,0%subjetswith server neurocognitive disorder ( p< 0,05).
3.1.2. The degree of neurocognitive disorder of subjects through MoCa scale
Table 3.2. The degree of neurocognitive disorder of subjects through MoCa scale
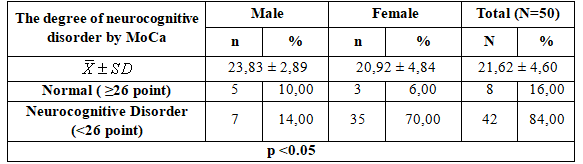
- The average MoCA was 21.62 ± 4.60 study points ,the average MMSE score is higher in male than female ( 23.83 ± 2.89 vs 20.92 ± 4,84 points).
- 84.00% of patients with cognitive impairment according to MoCA and 16.00% scale of the study subjects had normal awareness.
3.2. The correlation between the degree of neurocognitive disorder and risk factors
3.2.1. Clinical practice
Table 3.3. The correlation between the degree of neurocognitive disorder
and risk factors in clinical practice
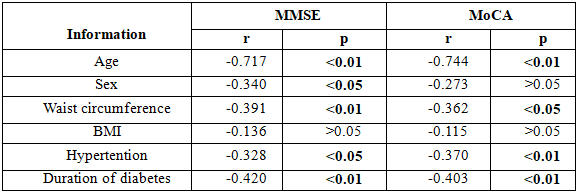 – Age, waist circumference index, duration of diabetes, blood pressure index fairly closely negatively correlated with the degree of cognitive decline over two MMSE and MoCA scale (p <0.01).
3.2.2. Subclinical
Table 3.4. The correlation between the degree of neurocognitive disorder and risk factors in subclinical
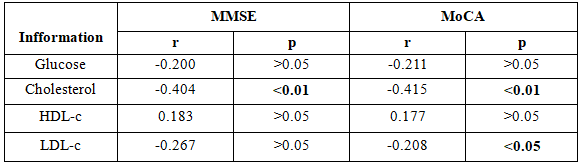 – The blood cholesterol was inversely correlated closely with levels of cognitive decline (p <0.01)
LDL.c index have inversely correlated with moderate cognitive impairment through MOCA scale (p <0.05).
3.3. Cut off and AUC- ROC between the risk factors with MMSE and MoCa scale
3.3.1. Cut off and AUC- ROC between the risk factors with
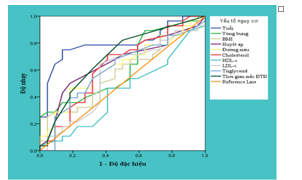
Map 3.1. Cut off and AUC- ROC between the risk factors with MMSE scale
– If assessment of neurocognitive disorder by MMSE scale, the risk factors age and duration of diabetes had a higher AUC-ROC remaining elements include: gender (79,9%), cholesterol (63,2%), triglycerid (60,6%), blood pressure systolic (64,8%), blood glucose (62,1%), p < 0,05.
3.3.2. Cut off and AUC- ROC between the risk factors with MoCa scale
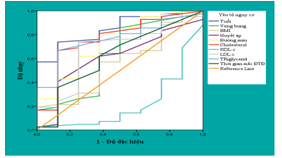
Map 3.4:Cut off and AUC- ROC between the risk factors with MoCa scale
– If Moca scale assessing neurocognitive disorder with the risk factors, the AUC ROC of factors such as age (85%, p< 0,01), duration of diabetes (62,2%), blood lipid, blood sugar was over 60%. It should be noted that the index decreases the level HDL.c so neurocognitive disorder increased.
3.4.3. Compare the level of assessment neurocognitive disorder of MMSE and MoCA
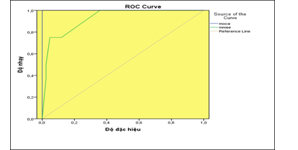
Map 3.3. Compare the level of assessment NMD of MMSE and MoCA
MoCA scale sensitive than the MMSE scale in assessing the neurocognitive disorder in type 2 diabetic patients. AUC ROC of MoCa scale is 98%, Se=89%, Sp=99% CI ( 0,95-1) and AUC ROC of MMSE scale is 88% Se=82%, Sp=88% CI (0,78-0,92), Kappa=2, p<0,001
Table 3.5. Compare the UAC-ROCl of assessment neurocognitive disorder
of MMSE and MoCA
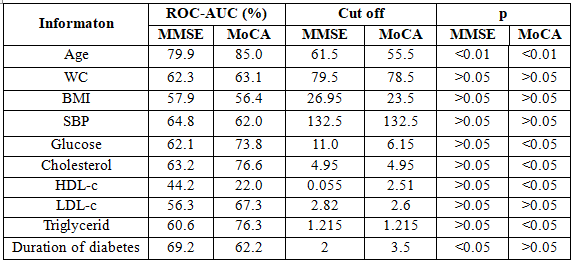 The area under the ROC curve between MoCA scale to risk factorslarger than the MMSE scale: age, Waist circumference , BMI, Chol, LDL-c, Triglycerid.
The cut off corresponding of MOCA scale are smaller MMSE scale but with sensitivity and specificity are higher
3.4. The correlation between brain MRI and MMSE & MOCA
Table 3.6. The correlation between brain MRI and MMSE & MOCA
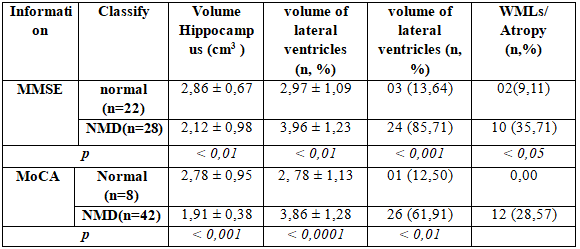
The volume of the hippocampus and hippocampal greatly decreased statistically significant (2,86 ± 0,67 with 2,12 ± 0,98; p <0,01 by MMSE and 2,78 ± 0,95 with 1,91 ± 0,38; p <0,001 by MOCA) in subjects neurocognitive disoeder through MRI imaging.
The volume of lateral ventricles in type 2 diabetes have major neurocognitive disorder higher the subjects with normal neurocognitive function. This difference is statistically significant (p <0,0001)
54% (27/50) in the study subjects haveone to multilacunar, in which 61.91% subjectshave major neurocognitive disorder by MOCA and 85.71% subjects has recognized major neurocognitive disorder by MMSE.
Diabetic encephalopathy have associated white matter atrophy phenomenon accounts for 28.57% in subjects with major neurocognitive disorder by MOCA.
In the study by Jack et al (1991) had shown 85%volume of the hippocampus in the early stages of Alzheimer’s patients are lower than the control group. Pearlson et al (1992) had found the areas of the hippocampus, and the hippocampus 60% area reduction with Alzheimer’s group compared to the control group. In 1993, Killiany and all(2000) can identify correctly 100% of the lesions combined volume of the hippocampus, temporal lobe and lateral ventricles in Alzheimer’s patient [ 7].
Jeroen de Bresser et al (2010) had showed the relationship between brain atrophy and white matter encephalopathy in the diabetic patients through MRI. This research had showed association between ventricular volume expansion process affects the hippocampal atrophy and thalamus, as well as the lesions appeared typical defect microvascular disease in the brain diabetic patient [6]
A survey in 1125 subjects with diabetes (CASCADE) by Reinhold Schmidt et al (2004) had showed a close correlation between the level of quite cerebral atrophy, white matter brain damage high, multi-lacunar infarction defect in control groups [9]
3.4.2. The degree of neurocognitive impairement by DSM 5
Apply the DSM 5 scale have update in 2016 so that the stratification of subjects cognitive research after evaluating the classification with or without neurocognitive disorder by Moca scale:
Table 3.6. Percentage NCD by DSM 5 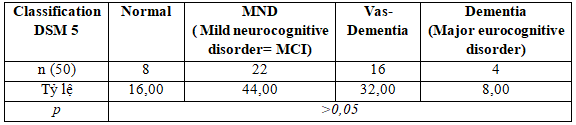
We found that among the patients with neurocognitive disorder according to MOCA, after putting on the DSM 5 classification, up to 8% subjects have dementia, 32% subjects have vascular dementia, and the major neurocognitive disoerder is 44% in this subjects ( Differences are not statistically significant between-group in the study subjects.
3.4.3. The correlation between brain MRI and DSM 5
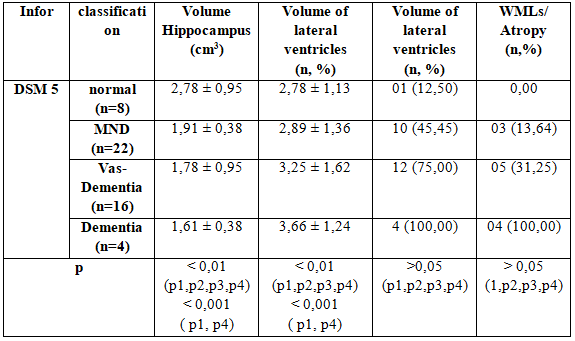
Table 3.7: The correlation between brain MRI and DSM 5
 Comparison with other studies:
Jeroen de Bresser et al (2010), brain atrophy, WMLs, NMN defect related to microvascular damage.
The CASCADE research, Reinhold Schmidt et al (2004) had showed a close correlation between the level of quite cerebral atrophy, white matter brain damage, lacunarl infarcts than in the control group.
Stratified according to NMD from mild to dementia, we found that hippocampal volume reduction between the study groups. Specifically in the group with normal cognitive with NMD group to change about the volume hippocampus 2.78 ± 0.95 compare with 0.38 ± 1.91 respectively; between dementia groups have the most decreased volume hippocampus : 1.61 ± 0.38 to 2.78 ± 0.95 compared to the normal groups (p <0.001)
Similarly the ventricular volume changes also increased the proportion with the severity of NMD: 2.78 ± 3.66 ± 1.13 versus 1.24 (p <0.001).It is worth noting that at the time of expression mild cognitive impairment (NMD) are not the ventricular volume and the volume of the hippocampus has also changed pretty. And this change has tended to increase with the severity and duration of diabetes .
White matter brain damage and brain atrophy situation was also discovered 100% of patients with dementia and 31.22% for vascular dementia, 13.64% decline in the group with mild cognitive neurological . However, this difference is not statistically significant.
4. Conclusions
We have many results in this research:
4.1. MOCA scale is more valuable insensitivity and specificity when evaluating awareness in patients with diabetes compared to MMSE scale (AUC ROC of MoCa 98%, Se=89%, Sp=99% CI (0,95-1) and AUC ROC of MMSE 88% Se=82%, Sp=88% CI (0,78-0,92), Kappa=2, p<0,001).
4.2. The common form of brain injury on brain MRI in patients with diabetes is to reduce the volume of the thalamus, lateral ventricular volume expansion, cerebral infarction and encephalopathy defect + white matter atrophy.
4.3. The volume of the thalamus and hippocampal was greatly reduced with statistical significance (2,86 ± 0,67 so với 2,12 ± 0,98; p <0,01 by MMSE and 2,78 ± 0,95 so with 1,91 ± 0,38; p< 0,001 by MoCa) in the subjects NMD.
4.4. Stratified cognitive neurological deficits under DSM 5 with MRI imaging condition recorded hippocampal volume reduction on the level progressive neurocognitive disorder between the normal groups, mild cognitive impairment and dementia decline, corresponding to Volume particular among groups thalamus : 2,78 ± 0,95; 1,91 ± 0,38; 1,61 ± 0,38 ; p < 0,001.
4.5. The change in lateral ventricles volume ratio also increases with the severity of cognitive impairment from normal to neurological impairment to mild cognitive dementia: 2,78 ± 1,13; 2,89 ± 1,36; 3,66 ± 1,24 ( p< 0,001).
4.6. 100% white matter brain damage and brain atrophy condition occurs in patients with dementia and 31.22% for vascular dementia, 13.64% decline in the group with mild cognitive neurological. However, this difference is not statistically significant (p> 0.05)
4.7. It should be noted that at the moment the signs of mild cognitive impairment (NMD) are not only the ventricular volume and hippocampal volume but also changes in brain white matter lesions and brain atrophy appear . And this change has tended to increase with increasing severity (increased blood sugar, increased blood fats, blood sugar several times), and duration of diabetes.
II. RECOMMENDATIONS
The neurocognitive disorder in the diabetic patient have showed that diabetic encepalopathy (DE),DE presents itself both mentally and physically. The leading clinical syndrome of DE is cognitive dysfunction. Development of mild to moderate cognitive dysfunction significantly reduces the quality of life of the diabetic patients, and is associated with significant risk of subsequent development of dementia and severe disability.
The neurocognitive disorder is a resistant cerebral pathology that occurs in type 2 diabetic patients as a result of chronic hyperglycemia, disturbances of signaling effects of insulin in the brain as well as metabolic disorders induced under these conditions. Association of neurocognitive disorders with disease duration, HbA1c level, impaired brain activity, cerebral hemodynamics and cerebrovascular reactivity was established. Chronic cerebrovascular accident plays a role in the development of DE, the pathogenesis of which is due to formation of diabetic cerebral micro- and macroangiopathy. The result pathobiology of the accumulation of β-amyloid and tau protein which have destroyed the structure of the brain cells .
DSM 5 criteria for the clinical diagnosis Demential or Vas-Demential, Mild Cognitive Impairement- as recommended by the National Institute for Health and Care Excellence (NICE).
Screening for diabetic encephalopathy by MoCa or MMSE and MRI scanning may show evidence of infarcts, cortical lacunae, and extensive white matter changes. Appearances will vary depending on the pathogenesis. It may help distinguish VaD from Alzheimer’s disease. Medication reviewis important to ensure that cognitive decline is not due to medication. Other reversible organic causes alsoneed to be excluded.
REFERENCES
- AbbatecolaAM,PaolissoG,LamponiM,BandinelliS,Laure-taniF,LaunerL,FerrucciL(2004),Insulinresistanceandexecutivedysfunctioninolderpersons,JamGeriatrSoc,52,pp.1713–1718.
- Brickman,JordanMuraskin,MollyE.Zimmerman(2009),StructuralneuroimaginginAlzheimer’sdisease:dowhitematterhyperintensitiesmatter?,Clinicalresearch,vol36,pp.181-190.
- Murray,RogerT.Staff,SusanD.Shenkin(2005),BrainWhiteMatterHyperintensities:RelativeImportanceofVascularRiskFactorsinNondementedElderlyPeople,Radiology,237,pp.251-257.
- DeniseFeil,CarolynW.Zhu(2011),TherelationshipbetweencognitiveimpairmentanddiabetesselfmanagementinapopulationbasedcommunitysampleofolderadultswithType2diabetes,Therelationshipbetweencognitiveimpairmentanddiabetes,JBehavMed,35,pp.190–199.
- HoffmanWH,ArtlettCM,ZhangW,KreipkeCW,PassmoreGG,RafolsJA,SimaAAF(2008),ReceptorforadvancedglycationendproductsandneuronaldeficitinthefatalbrainedemaofBrainRes1238,pp.154–162.
- JeroendeBresser,WillemP.Mali,AudreyTienhuis,etal(2010),Progressionofcerebralatrophyandwhitematterhyperintensitiesinpatientswithtype2diabetes,DiabetesCare,33,pp.1309-1314.
- J.,KappelleL.J.(2006),Diabeticencephalopathy:acerebrovasculardisorder?JournalSanneManschot,ISBN-10:90-393-4204-0,pp.1-149.
- PeilaR,RodriquezBL,LaunerLJ(2002),Type2diabetes,APOEgeneandtheriskfordementiaandrelatedpathologies:TheHonolulu-AsiaAgingStudy,Diabetes,vol51,tr.1256-1262.
- RyanCM,GeckleMO(2000),Circumscribedcognitivedysfunctioninmiddleagedadultswithtype2diabetes,DiabetesCare,vol23,pp.1486–1493.
- RajashreeR,S.D.KholkuteandS.S.Goudar(2012),EffectsofDurationofDiabetesonCognitiveFunctionsinStreptozotocinInducedYoungDiabeticRats,AJMS,vol3,pp.256-263.
- Manschot,AugustinaM.A.Brandsetal(2006),BrainMagneticResonance ImagingCorrelates ofImpairedCognitioninPatientsWith Type 2 Diabetes,Diabetes,vol55,pp.1106-1115.
- SaraNunes,EdnaSoares,FredericoPereira,FlávioReis(2012),Theroleofinflammationindiabeticcardiomyopathy,InternationalJournalofInterferon,CytokineandMediatorResearch,vol4,59–73.
- SaraNunes,EdnaSoares,FredericoPereira,FlávioReis(2012),Diabeticencephalopathy:theroleofoxidativestressandinflammationintype2diabetes,InternationalJournalofInterferon,CytokineandMediatorResearch,vol4,75-85.
- VanHartenB,OostermanJ,MuslimovicD,vanLoonBJ,ScheltensP,WeinsteinHC(2007),CognitiveimpairmentofMRIcorrelatesintheelderlypatientswithtype2diabetesmellitus,AgeAgeing,vol36,pp.164–170.
- M.,SirishaG.B.N.,FarzanaBegamandDhanaraju(2012),MechanismLinkingCognitiveImpairmentandDiabetesmellitus,EuropeanJournalofAppliedSciences,vol4,pp.1-5.
- YaelReijmer,Esther vanden Bergetal(2010),Cognitivedysfunctioninpatientswithtype2diabetes,DiabetesMetabolismResearchandReviews,26,pp.507-519.
- YaelReijmer,EsthervandenBergetal(2010),Acceleratedcognitivedeclineinpatientswithtype2diabetes:MRIcorrelatesandriskfactors,DiabetesMetabolismResearchandReviews,27,pp.195-202.
- ZubinPunthakee,MarkD.Sullivan,etal(2012),PoorCognitiveFunctionandRiskofSevereHypoglycemiaintype2diabetes,DiabetesCare,35,pp.787-793.