 Hội Nội Tiết – Đái Tháo Đường Miền Trung Việt Nam Hội Nội Tiết – Đái Tháo Đường Miền Trung Việt Nam
ASSOCIATED FACTORS WITH CONSTIPATION IN ELDERLY DIABETIC PATIENTS
Nguyen Trung Anh 1,2, Nguyen Ngoc Tam 1,2 , Vu Thi Thanh Huyen 1,2
1Hanoi Medical University, Hanoi, Vietnam
2National Geriatric Hospital, Hanoi, Vietnam
DOI: 10.47122/vjde.2021.48.2
ABSTRACT
Background: Rarely researches about related factors for constipation for older diabetics patient. Objectives: Assess some associated factors with constipation in older diabetic patients. Methods: A cross-sectional study was conducted in National Geriatric hospital in three months (from July to October, 2020). Related factors was determined by using Mini Nutrition Assessment (MNA-SF), Instrumental Activities of Daily Livings (IADLs), Activities of Daily Livings (ADLs), The 3 Incontinence Questions (3IQ), and questions about daily fiber and water. Results: Drinking <1000 ml water per day (adjusted OR = 4.203, p=0.000. Eating vegestable < 1 bowl per day (adjusted OR = 5.752, p=0.000) Regarding physical function (ADL) (adjusted OR = 2.548, p=0.001) Regarding instrument activities of daliy living (IADL), (adjusted OR= 1.784, p=0.044) BMI ≥ 23 (adjusted OR: 1.914, p = 0.026) Factors that decrease the risk of constipation: Living with family (adjusted OR = 0.253, p=0.02). Conclusion: Management the related factors with higher odd ratio of constipation in older diabetic patients was important in daily practice
Keywords: constipation, older diabetic patients, related factors
Main correspondence: Nguyen Trung Anh Submission date: 20th April 2021 Revised date: 26th April 2021 Acceptance date: 26th May 2020
Email: [email protected] Tel: 0903480774
1. BACKGROUND
The number of cases of diabetes is expected to reach 629 million by 2045, and this number will increase sharply in developing countries, especially in India and Southeast Asia. Then only about 6 percent of patients meet targets for treatment [1]. In Vietnam, according to the STEPwise survey of risk factors for non- communicable diseases conducted by the Ministry of Health in 2015, national diabetes prevalence in the age is 4.1%. It is 3.6 percent for pre-diabetes [2].
Constipation is a clinical condition based on signs of incomplete removal of stool, trouble moving stool, or both. Similar values were found for people over the age of 60 [3]. A population- based study recorded a higher cumulative prevalence of chronic constipation in the older (~20 percent) relative to the younger population [4]. Constipation is more common in older women, with constipation rates two to three times higher than those of their male counterparts. Constipation often adversely affects the quality of life associated with wellbeing, with psychological and social implications [5].
Some authors have examined several aspects of patients with diabetes, however there are no general statistics on the prevalence of constipation among older people with diabetes around the world, although patients with diabetes are at risk of developing constipation. The aim of thí study was to assess some associated factors with constipation in older diabetic patients.
2. METHOD
2.1. Study population
Inclusion Criteria:
- Patients aged 60 years old or above attending National Geriatric Hospital were consecutively recruited in
- Patients and patient’s family agreed to participate.
- The patients have the physical and cognitive abilities to do a face-to-face interview.
- Diagnostic criteria for Diabetes : According to the American Diabetes Association – ADA 2019, diagnostic criteria for diabetes
Exclusion Criteria:
- Patients were inability to
- Patients with mental health problems
- Patients or families refused to participate in the
Part 1: Social Demography:
Interviewing participants with a unified research record. Participants responded according to the following information:
Part 2: Constipation in older people Have 6 questions Yes or No to ask:
+ Hard to push stool for 25% of the time
+ Divide solid or lumpy in at least 25% of the bowel movements;
+ Leeling of no bowel movements in at least 25% of the bowel movements;
+ Feeling of congestion in rectal anus for at least 25% of the time defecation;
+ Manual manipulations should be made to facilitate defecation in at least 25% of the defecation times (e.g., finger-hooking, pelvic floor support);
+ Defecation less than 3 times / week
Responding 2 of the 6 criterias will be diagnosed as constipation.
Part 3: Characteristics related to diabetes disease
* Duration, treatment for
- Ask participants about how long ago when they started being diagnosed with diabetes
- Ask participants current treatment regimen: diet/lifestyle only, use pill only, use insulin only, pill + insulin injection or herbal medicine.
* Chronic complications of
- Using a multi-choice questionnaire so that participants can list all the existing complications of
* Hypoglycemia
Part 4: Others related factors
- Nutrition (MNA-SF)
- Instrumental Activities of Daily Livings (IADLs)
- Activities of Daily Livings (ADLs)
- The 3 Incontinence Questions (3IQ)
– Ask about the total daily amount of water Calculated in ml units, calculate the total amount of water to drink in a day and the amount of water in soup, milk ….
– Ask about the amount of green vegetables consumed in a day.
Calculated according to the rice bowl unit. Measure the total amount of vegetables eaten in day ( 80g = ½ a bowl)
2.2. Data analysis
The process of data coding, entry into Redcap and analysis was done by using Statistical Package for Social Science (SPSS) software (version 20). Inferential statistics was done to perform comparisons between groups: Chi-square. Multivariables logistic regression was used to assess some related factors for constipation. Statistical significance was accepted at the 95% confidence level (p<0.05)
3. RESULTS
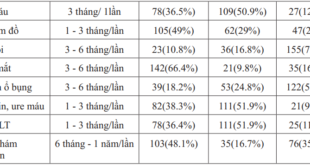
Table 1. Correlation between constipation prevalence and duration of diabetes and treatment therapy (N=203)
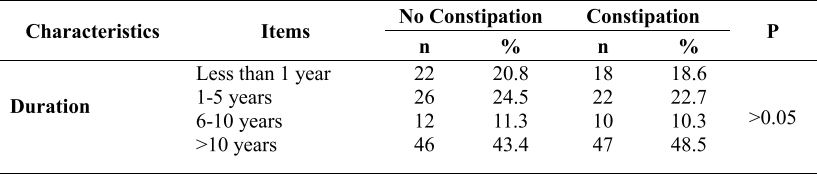
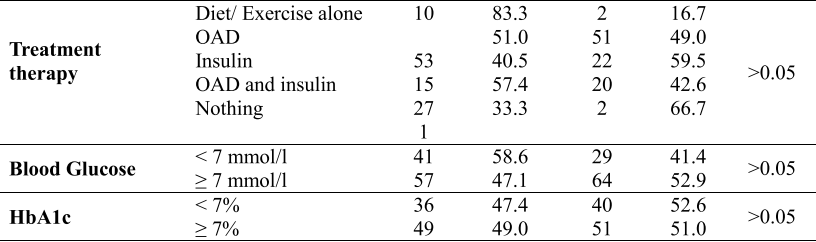
The rate of constipation is highest when the duration of diabetes is more than 10 years (48.5%). The lowest rate of constipation is when they have diabetes for 6 to 10 years (10.3%), which is half of the time with diabetes from 1 to 5 years (22.7%). However, there was no association between constipation status and these diseases-related factors: duration, treatment therapy (p>0.05). No correlation was found between constipation and blood glucose and HbA1c.
Table 2. Multivariable logistic regression association between constipation and related factors (n=203)
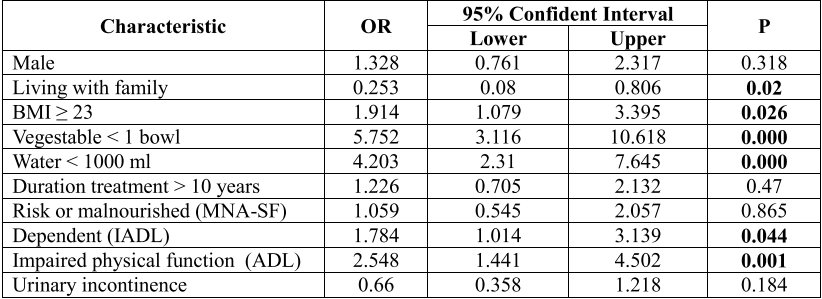
People living with family ( adjusted OR: 0.253, 95% CI: 0.08- 0.806) had lower odds ratio for constipation among older patients (p = 0.02). Drinking <1000 ml water per day was associated with higher risk for constipation in older patients ( adjusted OR: 4.203, 95% CI: 2.31 – 7.645) ( p ≤ 0.001) had higher odds in constipation (p ≤ 0.001). People eat vegestable < 1 bowl per day (adjusted OR = 5.752, 95% CI: 3.116-10.618) had higher odds in constipation ( p ≤ 0.001).
Regarding physical function (ADL) in constipated patient, the rate of decline is 2,548 times higher than that of normal people (95% CI: 1,441-3,139) (p = 0.001). Regarding instrument activities of daliy living (IADL), the rate of dependent is 1.784 times higher than that of normal people (95% CI: 1.014- 3.139) with p=0.044. People with BMI ≥ 23 (adjusted OR: 1.914, 95% CI: 1.079-3.395) have a high rate of constipation (p = 0.026).
4. DICUSSION
In this study, the rate of constipation among diabetic patients was 48%. Several studies have reported an association between constipation and diabetes. Bytzer et al. performed a mail- based survey of 15,000 people in Australia and confirmed that diabetes had an OR of 1.8 for any intestinal symptoms, 1.5 for constipation, and also demonstrated correlation between symptoms and low glycemic control [6].
In this study, the mean score of ADL and IADL was 4.197 (SD=2.39) and 5.2 (SD=2.83) respectively. It was difference finds in previous study, the mean score of ADL was 2 ( 0-6). The MNA mean score was 9.22 ± 2.4 points, at risk of malnutrition. It means in general, older diabetes at National Geriatric Hospital had risk of malnutrition status.
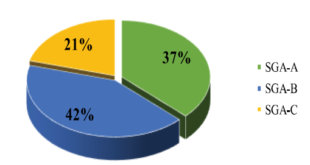
This study found that 77.8% of patients had risk of malnutrition and malnourished. Moreover, 25.4% of participants was overweight or obesity. In this study, the mean body mass index (BMI) of the participants was 21.96 ± 3.2; 28.57% of patients got urinary incontinence.
The research conducted that there difference was not static significant between 2 genders, disease-related factors, nutrition status, urinary incontinence and constipation.
The study result showed a correlation between constipation prevalence and function dependence. The more activities patients need help, or in other words, the more dependent they were, the more constipation they would be. A correlation between constipation prevalence and amount of water drink per day. Drinking less than 1000 ml of water per day will increase the risk of constipation. A correlation between constipation prevalence and amount of vegestable eat per day. Eating less than 1 bowl of vegestable per day will increase the risk of constipation. There was a significant correlation between body mass index (BMI) and constipation rate.
5. CONCLUSIONS
There was a correlation between constipation with drink <1000 ml water per day, eat vegetables < 1 bowl per day, living with family, regard physical function, regard instrument activities of daliy living and BMI ≥ 23. Management the related factors with higher odd ratio of constipation in older diabetic patients was important in daily practice
REFERENCES
- N. H. Cho et al, (2018). “Global estimates of diabetes prevalence for 2017 and projections for 2045”, Pract., 138, 271–281.
- M. o. Health, (2017). “Guide and diagnose diabetes treatment”, Minister of Health.
- J. S. Milne and J. Williamson, (1972). “Bowel habit in older people”, Gerontol Clin (Basel), 1972, 1, 56–60.
- A. Wald et al, (2008). “A multinational survey of prevalence and patterns of laxative use among adults with self-defined constipation”, Aliment. Pharmacol. Ther, 7, 917–930.
- D. Grundy et al, (2006). “Fundamentals of neurogastroenterology: basic science”, Gastroenterology. 5, 1391–1411
- P. Bytzer, S. Howell, M. Leemon,. et al (2001). “Low socioeconomic class is a risk factor for upper and lower gastrointestinal symptoms: a population-based study in 15 000 Australian adults”, Gut, 1, 66–72.