 Hội Nội Tiết – Đái Tháo Đường Miền Trung Việt Nam Hội Nội Tiết – Đái Tháo Đường Miền Trung Việt Nam
FATTY LIVER INDEX (FLI) AND NON ALCOHOLIC FATTY LIVER DISEASE -FATTY LIVER SCORE (NAFLD-FLS) OF STEATOSIS IN ELDERLY TYPE 2 DIABETIC PATIENTS
Ho Thi Kim Thanh, Do Thi Huong
Hanoi medical university, National Geriatric Hospital
ABSTRACT
We aimed to study the prevalence and the predictive factors of non-alcoholic fatty liver disease (NAFLD) defined by the fatty liver index (FLI) and NAFLD- LFS (Non alcoholic fatty liver disease – fatty liver score) in elderly type 2 diabetic patients (T2DM). Methods. 98 elderly type 2 diabetic patients with Hepatic steatosis (HS) by ultrasound and 74 T2DM without HS were included. FLI, a surrogate steatosis biomarker based on body mass index (BMI), waist circumference (WC), triglycerides (TGL) and gammaglutamyl-transferase (GGT), and NAFLD- LFS based on metabolic syndrome, T2DM, insulin, AST/ ALT were used to assess NAFLD in all patients. Hepatic steatosis was evaluated by ultrasonography. Results: Average NAFLD-FLI and NAFLD- LFS in T2DM old patients with HS was 53.36 ± 18.66 and 1.62± 2.36. NAFLD-FLI and NAFLD- LFS increased as HS severity increased. 35.7% patients with HS had FLI ≥ 60, 85.7% patients with HS hadNAFLD- FLS ≥ -0,64. GGT correlated closely with FLI (p<0.05). NAFLD- FLS correlated closely with blood insulin level, r= 0,98, p<0.001. Conclusions. NAFLD-FLI and LFS could be useful to identify NAFLD in T2DM old patients.
Keywords: nonalcoholic fatty liver disease, fatty liver index, old patients, type 2 diabetes
Main correspondence: Ho Thi Kim Thanh
Submission date: 8 Feb 2017
Revised date: 20 Feb 2017
Acceptance date: 15Mar 2017
I.BACKGROUND
Diabetes mellitus is a chronic metabolic disorder of glucide characterized by hyperglycemia and metabolic disorders of glucide, lipid, protid which are resulted from a deficiency or reduction of insulin action or a combination of both [1, 2]. The prevalence of diabetes has increased rapidly around the world, especially in Vietnam [1,3]. The liver plays a very important role in regulating the body’s blood sugar levels. The accumulation of fat in the liver increases insulin resistance. Many studies have shown that 80% of people with type 2 diabetes suffer from fatty liver[4] and nonalcoholic fatty liver increases the risk of type 2 diabetes. Nonalcoholic fatty liver is defined by the accumulation of fat cells over 5% of the liver cells or more than 5g fat per 100g liver in people who consume less than or equal 20gram alcohol / day (female), 30gram alcohol / day (male) [5, 6, 7]. According to data from the National Health Organization and Nutrition of United States (NHANES), since 1998- 2008 the proportion of nonalcoholic fatty liver in chronic liver disease accounts for from 45% to 75% and accounts for 10% – 30% of the population in different countries [5]. This disease is increasingly attracting scientists. Many diagnostic methods for nonalcoholic fatty liver are suggested in research and clinical practice with simple and exact goals. Histopathology is the gold standard for the diagnosis of nonalcoholic fatty liver, This is, however, not the routine method in clinical practice [8, 9]. In recent years, many foreign authors have studied and reported that FLI and NAFLD-FLS are likely equal with ultrasound in the diagnosis of steatosis [10, 11, 12] . At medical facilities without good ultrasound equipment or lack of experienced doctors, it is possible to use other additional indicators. Therefore, this research was carried out with these two objectives:
- To estimate the proportion of fatty liver by using FLI and NAFLD- FLS in the type 2 diabetic patients.
- To determine the relationship between some clinical and subclinical characteristics of hepatic steatosis and FLI and NAFLD-FLS.
II.METHODS
2.1. Study population
- Inclusion criteria:
– Patients with diabetes type 2, who agreed to participate in the study
– Patients over 60 years old, diagnosed with steatosis by ultrasound
- Exclusion criteria:
-Patients with HBsAg positive or anti HCV positive
-Patients with alcohol or drug-induced steatosis
-Transaminase level over 3 times normal reference.
-Cirrhosis; Alcoholism
2.2. Research Methods:
– Research Methodology: a cross-sectional, descriptive epidemiological study.
– The included patients were interviewed, examined and tested. A unified patient’s record form was used.
FLI (fatty liver index): FLI= eL/ (1 + e) * 100
L= [ 0.953* ln (TG) + 0.139 * BMI + 0.718* ln(GGT) + 0.053(waist) – 15.744 ]
- TG in mg/ dl, GGT in U/l, waist in cm.
FLI scores from 0-100 and the estimated percentage of having a fatty liver FLI as below:
+ FLI ≥ 60: steatosis is diagnosed
+ FLI < 30: non-fatty liver
+ 30 ≤ FLI < 60: fatty liver is suspected
NAFLD- LFS Index
(Non alcoholic fatty liver disease – fatty liver score)
The formula: NAFLD – FLS = [ -2.889 + 1.179 * metabolic syndrome (Yes = 1, No = 0) + 0.454 * diabetes type 2 (Yes =2 , No=0) + 0.145 * insulin + 0.038 * AST – 0.936 * AST/ ALT ]
With insulin in µU / l, AST and ALT were measured by U/L.
+If NAFLD- FLS < -0.64: non-fatty liver
+ If NAFLD- FLS ≥ -0.64: fatty liver
– Data were processed by SPSS version 15.0.
2.3. Research ethics:
The study has complied with rules of ethics in biomedical researches. All subjects agreed to participate in the study and could withdraw at any time. Personal information as well as research results are confidential according to regulations.
III. RESULTS
During the period from November 2014 to July 2015, with 98 type 2 diabetic patients with fatty liver were examined and treated at the Endocrinology Department and Out-patient Department of National Geriatric Hospital, and 74 diabetic non-fatty liver patientswere tested, and the following results were obtained:
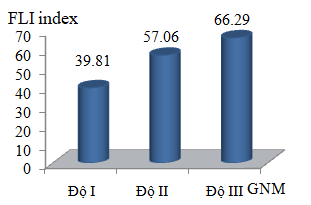
Chart 3.1: FLI with the severity of fatty liver
Comments:In 98 type 2 diabetic patients, the more severity of fatty liver, the more increased the FLI index (p <0.001).
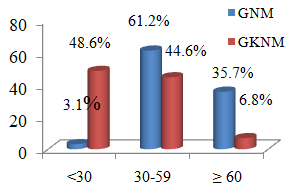
Chart 3.2: The proportion of fatty liver by FLI index
Comments: The difference in FLI index ≥ 60 of fatty liver group (35.7%) and non-fatty liver group (6.8%) was statistically significant with p <0.001.
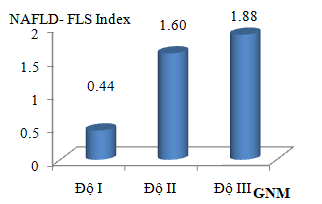
Chart 3.3: The average NAFLD- FLS with severity of fatty liver
Comments:The severity of steatosis increased with NAFLD- FLS index (p <0.001).
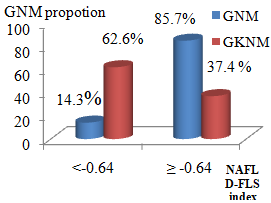
Chart 3.4: The proportion of fatty liver by NAFLD- FLS Index
Comments: The difference in the value of FLS NAFLD index ≥ -0.64 in type 2 diabetic fatty liver group (85.7%) and non-fatty liver group (37.8%) was statistically significant with p <0.001.
Table 3.1: The average level of ASL, ALT, GGT with FLI index
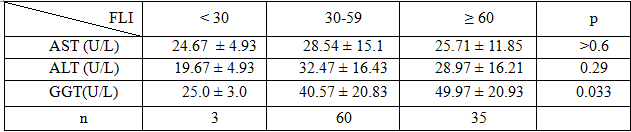 Comments:The change in AST and ALT values were not significantdifferent. The change in the GGT value with FLI index was statistically significant with p <0.05.
- The average insulin level with NAFLD- FLS index
Table 3.2: The average insulin level with NAFLD- FLS index
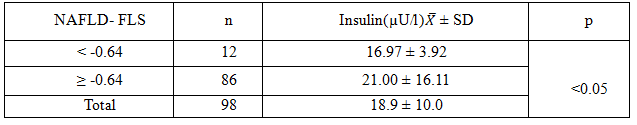 Comments: The insulin level increased with NAFLD- FLS index, r= 0.98.The correlation was positive with p <0.001.
IV. Discussion:
In this study, 98 type 2 diabetic patients with fatty liver (diagnosed by abdominal ultrasound) and 74 non-fatty liver type 2 diabetic patients were similar in age, gender and liver enzymes. The average GGT value of the type 2 diabetic fatty liver group was statistical higher than that of non-fatty liver group (43.45 ±21.18U/L in comparison with 34.34 ± 15.14U/L; p<0.05). GGT was an independent predictor for fatty liver as many authors have mentioned [11, 12, 13].
This research has shown that the average value of FLI index in fatty liver type 2 diabetic group was much higher than non-fatty liver type 2 diabetic group (53.36 ± 18.66 and 26.46 ± 17.16 respectively, p < 0.001). This result is similar to that of other studies. For example, in a study of 13.255 fatty liver patients and 16.542 non-fatty patients, the average FLI index of two groups were 41.75± 24.58 and 15.61 ± 16.27 respectively [14, 15]. FLI index was calculated based on the value of GGT, triglycerides, BMI and waist circumference, so these higher values increase will make the FLI index higher. In type 2 diabetic patients, metabolic disorder is common so triglyceride level is often high whereas tests in fatty liver patients are rarely affected.
FLI value increases with the degree of hepatic steatosis: 39.81 ± 15.83 in severity I, 57.06 ± 13.98 in severity II and 66.29 ± 15.86 in severity III (p<0.001). In this study, the cut-off of FLI index to diagnose fatty liver was applied with value ≥ 60. In 98 type 2 fatty liver patients, the FLI index ≥ 60 was observed in 35 patients (35.7%),only 3.1% patients had FLI <30. In the study of Ina-Maria Rückert [16], 39.8% of 3001 patients aged 32-81 had the value of FLI ≥ 60. Giorgio Bedogni’s report [17] has shown that 36% of 216 fatty liver patients had FLI index ≥ 60. The result of our study on the proportion of fatty liver by FLI index is similar with those two authors.
In our study, the average value of NAFLD- FLS index of fatty liver type 2 diabetic group was higher than that of non-fatty liver group (1.62 ± 2.36 in compared with -1.51± 2.06, p<0.001). Our result was similar with the result of Giovanni MusoM [18] (1.56 ± 0.29) with the research of 40/125 fatty liver type 2 diabetic patients (in which fatty liver was diagnosed by liver biopsy). In 98 type 2 diabetic fatty liver patients, the values of NAFLD- FLS index were corresponding to the degree of fatty liver: 0.44 ± 1.17 (severity I), 1.60 ± 2.18 (severity II) and 1.88 ± 3.14 (severity III). The higher severity of fatty liver, the higher of NAFLD- FLS index. The difference in the value of the NAFLD- FLS index with the severity of fatty liver was statistically significant at p <0.05, which is similar to the results of other studies [19].
In this research, we applied a cut-off value for the diagnosis of fatty liver by using NAFLD- FLS index ≥ -0.64. There were 84/98 patients with NAFLD- FLS index ≥ 0.64 (85.7%), 14.3% of patients with NAFLD- FLS index < -0.64. Among 84 fatty liver patients, the highest proportion were severity III group with NAFLD- FLS index ≥ -0.64 (38.1%), 27 patients with severity I (accounted for 32.14%) and 25 patients with severity II (29.76%). There was significant difference between our proportion of fatty liver by NAFLD- FLS index and Giovanni MusoMD’s research [18]. In Giovanni’s study, the proportion of patients with NAFLD- FLS index ≥ -0.64 was 42.5% (17/40 patients, fatty liver was diagnosed by histopathology). The reason was that the patients in Giovanni’s study were in steatohepatitis stage (23/40). Therefore, all the patients had the NAFLD- FLS index ≥ -0.64.
Type 2 diabetic fatty liver patients had average insulin level by NAFLD- FLS index: NAFLD- FLS <-0.64: 16.97 ± 3.92µU/l; NAFLD- FLS ≥ -0.64: 21.00 ± 16.11µU/l corresponding. The difference of average insulin level by NAFLD- FLS index was statistical with p < 0.05, which was similar to study result of Giovanni MusoMD [18]. Therefore, fatty liver is also one of the manifestations of insulin resistance [20, 21]. In our study, Trong nghiên cứu này, the correlation between the NAFLD- FLS index and insulin is positively correlated with correlation coefficient r = 0.98.
V. Conclusions:
Elderly diabetic patients with fatty liver had the average FLI and NAFLD- FLS scores of 53.36 ± 18.66 and 1.62± 2.36 respectively corresponding. 35.7% of fatty liver diabetic patients had FLI ≥ 60, 85.7% of the patients had NAFLD- FLS ≥ -0.64 by using ultrasound. The more severe the steatosis, the higher theFLI and NAFLD – FLS indice. These two indice were closely correlated with concentrations of serum GGT and insulin.
AcknowledgmentsWe express our sincere thanks to Endocrinology Department and Out-patient Department in National Geriatric Hospital for helping us in the collection of data.
REFERENCES
- Prashanth, M., et al. (2009). Prevalence of nonalcoholic fatty liver disease in patients with type 2 diabetes mellitus.J Assoc Physicians India. 57: p. 205-10.
- American Diabetes Association (2012). Diagnosis and Classification of Diabetes Mellitus.Diabetes Care: p. 64- 71.
- Lal B. R, Robyn J. Tapp (2012). Prevention of Type 2 Diabetes and Its Complications in Developing Countries: A Review.International Journal of Behavioral Medicine: p. 121–133.
- Nathalie C Leite (2014). Non-alcoholic fatty liver disease and diabetes: From physiopathological interplay to diagnosis and treatment. World Journal of Gastroenterol: p. 8377- 8392.
- Nobuyuki Toshikuni (2014). Clinical differences between alcoholic liver disease and nonalcoholic fatty liver disease.World J Gastroenterol: p. 8393 – 8406.
- Johannes Weiß (2014). Non-Alcoholic Fatty Liver Disease Epidemiology, Clinical Course, Investigation, and Treatment.Deutsches Atebl international: p. 447-452.
- Chalasani N (2012). The diagnosis and management of non-alcoholic fatty liver disease. Hepatology: p. 2005- 2023.
- Bravo AA, Sheth S.G., Chopra S. (2001). Liver biopsy.N Engl J Med. 344(7): p. 495-500.
- Phạm Thị Thu Hồ (2010), “gan nhiễm mỡ không do rượu: chẩn đoán và điều trị”.tạp trí khoa học tiêu hóa Việt Nam.
- Schreuder, T.C., et al. (2008). Nonalcoholic fatty liver disease: an overview of current insights in pathogenesis, diagnosis and treatment.World J Gastroenterol. 14(16): p. 2474-86.
- Melania Gaggini and Mariangela Morell (2013). Non-Alcoholic Fatty Liver Disease (NAFLD) and Its Connection with Insulin Resistance, Dyslipidemia, Atherosclerosis and Coronary Heart Disease.Nutrients: p. 1544- 1560.
- Lee, J.H., et al. (2010). Hepatic steatosis index: a simple screening tool reflecting nonalcoholic fatty liver disease.Dig Liver Dis. 42(7): p. 503-8.
- Willner IR (2001). “Ninety patients with nonalcoholic steatohepatitis: insulin resistance, familial tendency, and severity of disease”.Am Journal of Gastroenterol: p. 2957- 2961.
- Bi-Ling Yang et al (2015). External Validation of Fatty Liver Index for Identifying Ultrasonographic Fatty Liver in a Large-Scale Cross-Sectional Study in Taiwan.PLoS One. 10(3): e0120443
- Zhao Yan Jiang (2013). Fatty liver index correlated with non-alcoholic fatty liver disease, but not with newly diagnosed coronary atherosclerotic disease in Chinese patients.BMC Gastroenterol.13, 110
- Ina-Maria Rückert , Margit Heier, Wolfgang Rathmann,et al (2011). Association between Markers of Fatty Liver Disease and Impaired Glucose Regulation in Men and Women from the General Population.The KORA-F4-Study PLoS One.6(8), e22932
- Giorgio Bedogni,Henry S Kahn, Stefano Bellentani, Claudio Tiribelli (2006). A simple index of lipid overaccumulation is a good marker of liver steatosis.BioMed Central Gastroenterology.10, 98
- Musso G., Roberto Gambino, Marilena Durazzo, Maurizio Cassader (2010). Noninvasive assessment of liver disease severity with liver fat score and CK-18 in NAFLD: Prognostic value of liver fat equation goes beyond hepatic fat estimation.Hepatology. 51(2):715-7.
- Beverley Balkau Celine Lange; Sylviane Vol; Frederic Fumeron; Fabrice Bonnet (2010). Nine-year incident diabetes is predicted by fatty liver indices: the French D.E.S.I.R. study.BioMed Central Gastroenterology.10 (56)
- Nguyễn Hải Thuỷ, Nguyễn Đức Quang (2004). Nghiên cứu chức năng tế bào β tụy và kháng insulin ởbệnh nhân ĐTĐ phát hiện sau 40 tuổi.Kỷ yếu toàn văn các đề tài khoa học – Hội nghị khoa học toàn quốc chuyên ngành Nội tiết và Chuyển hoá lần thứ2. NXB y học: 323-332.
- Bùi Thị Thu Hoa, Nguyễn Hải Thủy (2008). Khảo sát tăng glucose máu ở bệnh nhân Gan nhiễm mỡ.Hội nghị Đái tháo Đường, Nội tiết và rối loạn chuyễn hóa Miền Trung lần thứ V: 587-593.