 Hội Nội Tiết – Đái Tháo Đường Miền Trung Việt Nam Hội Nội Tiết – Đái Tháo Đường Miền Trung Việt Nam
ASSESSMENT BONE MASS DENSITY IN NEW DIAGNOSED
GRAVE’S DISEASE
BoutsaBa Silathod, Do Trung Quan
Ha Noi Medical University
DOI: 10.47122/vjde.2020.40.2
ABSTRACT
Object: To assess bone mass density in new diagnosed Grave’s disease. Subjects: 60 Grave’s disease patients and 50 normal people that visited at outpatient department for required service, Bach Mai hospital, from October 2017 to July 2018. Methods: Cross-sectional study. Results: 6,66% of patients had osteoporosis at neck of thigh bone and this rate was 3,33% at spine. The bone mass density in new diagnosed Grave’s disease was lower than normal people. At neck of thigh bone: bone mass density in Grave’s disease was – 0,89 ± 1,07 (T – score) but only – 0,58 ± 1,06 (T – score) in control group (p > 0,05). At spine: bone mass density in Grave’s disease was – 0,35 ± 1,22 (T – score) and in control group was 0,068 ± 1,06 (T – score) (p < 0,05). Conclusions: There was no correlation between thyroid volume and bone mass density.
Key words: bone mass density, Grave’s disease.
Main correspondence: Do Trung Quan
Submission date: 5th May 2020
Revised date: 15th May 2020
Acceptance date: 25th June 2020
Email: [email protected]
1. BACKGROUND
Basedow’s disease (or Graves’ disease) is the most common endocrine disorder in the thyroid. The disease is characterized by diffuse enlargement of the thyroid gland, thyrotoxicosis, ophthalmic and orbital infiltrates, and occasionally skin infiltrates [1]. The disease occurs at any age, most commonly aged 20-40. In the late twentieth century, there have been many studies on bone mass density in patients with hyperthyroidism, who have demonstrated that the increased and prolonged thyroid hormone leads to bone loss and osteoporosis [2].Untreated, hyperthyroidism causes severe complications, including osteoporosis. Osteoporosis makes bones easy to fracture, the symptoms of osteoporosis are often discreet, when the weight of the bones takes about 30-40% to have clinical signs such as spine pain, scoliosis or fractures… , causing a decrease in quality of life, decreased mobility and treatment costs.
Osteoporosis due to hyperthyroidism is a common bone metabolism disorder. Therefore, early diagnostic of osteoporosis in patients with hyperthyroidism for treatment and prevention is very important. So far, there have been some studies on bone mass density assessment in female patients with Basedow’s disease in Vietnam, but no studies have measured bone density by DEXA method in newly diagnosis Basedow patients. Therefore, this study was conducted with the aim to assess bone density in newly diagnosis Basedow’s patients.
2. SUBJECTS AND METHODS
2.1. Subjects:
110 patients between 20 and 50 ages, both male and female, come for regular medical checkups and exams at Bach Mai Hospital from October 2017 to July 2018. These objects are divided into 2 groups:
- Basedow group (diesease group):
– Basedow patients was diagnosed according to the Minister of Health in 2015 (guiding the diagnosis and treatment of endocrine – metabolic diseases). Although Basedow patients have many clinical and subclinical symptoms, the diagnosis is based on a number of key symptoms: Enlarged thyroid (or mixed), frequent tachycardia, bulging eyes, fatigue ,hyperhidrosis, eats a lot, drinks a lot, loses weight, changes in mood, irritability, sleep disorders, weakness or cyclic paralysis, fingertips tremor. Subclinical: increased FT4, decreased TSH, TRAb positive or increased levels.
– These patients were diagnosed Basedow, newly discovered never use medication before.
– The patient agrees to participate in this study
– In the stage of thyrotoxicosis.
- Non-Basedow group (control group)
-Healthy patients that visited at outpatient department for required service, Bạch Mai hospital. Physical examination hadn’t symptoms of Basedow’s disease and other conditions. Subclinical: biochemistry, count blood cell, normal thyroid hormone. Patients agreed to participate in this study.
Exclusion criteria:
Basedow patients have been treated with antithyroid drug therapy.
– Patients had risk factors affect to osteoporosis: Long-term use of high doses glucocorticoids, Heparin, phenobacbital. Immobile for a long time, earlymenopause before age 40, overiectomy, gatrectomy.
– Other diesease conditions: Chronic renal failure, chronic liver failure, Kahler disease, hyperparathyroidism, diabetes, Cushing’s syndrome, metastatic cancer, and chronic obstructive pulmonary disease…
– Patients did not agree to participate in the study.
2.2. Methods
The study was performed from October 2017 to July 2018 at Bach Mai Hospital
2.2.1. Research design: Cross-sectional descriptive study
2.2.2. Sample size: convenient sample size
2.2.3. Method of implementation
The patients were asked questions and clinical examination: general information. Measure pulse, blood pressure, yourself and family history.
The patient was measured height, weight, and calculated the Body Mass Index (BMI). Assay: FT4, TSH, Trab
All patients were measured on the lumbar spine bone density of L1-L4 and femoral neck using the dual-energy X-ray absorption method (DEXA) using US Hologic Explorer.
To evaluate bone mass density results according to LX standard of WHO 1994:
– Normal BMD: T – score ≥ -1: BMD of the subject is equal to and over -1 standard deviation (ecart-type) compared to the average value of young adults.
– Decrease BMD: -1> T – score> -2,5: when BMD is from – 1 to – 2,5 standard deviation from the average value of young adults.
– Osteoporosis: T – score ≤ -2.5: when BMD is equal and lower and the fixed threshold is – 2.5, the standard deviation from the average value of young adults, at any position of the bone.
– Severe osteoporosis: T – score ≤ – 2.5 and have one or more fractures.
2.2.4. Data processing method:
Data were analysed by SPSS version 16.0
3. RESULTS
3.1. Distribution of research subjects by age group.
Table 4.1. Age distribution of study subjects
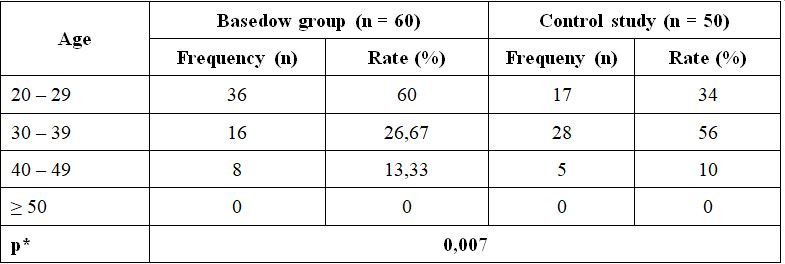
Comments: The most common age group in Basedow patients was from 20 to 29 years old with 36 patients accounting for 60%; This age group in the control group (the group without the disease) had 17 patients accounting for 34%. In both groups there was no case greater than 50 years old. The difference was statistically significant with p <0.05.
3.2. Gender distribution of study subjects
Table 3.2. Gender distribution of study subjects
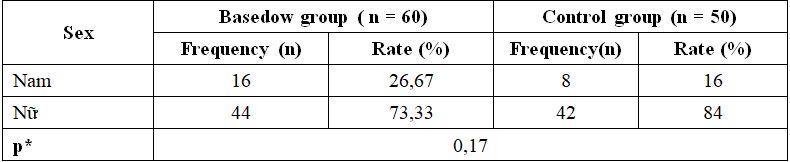
Comment: The gender distribution in both the control group and the control group were mainly in women. The women in the disease group accounted for 73.33% and the control group accounted for 84%, the difference was not statistically significant with p> 0.05.
3.3. Age, height, average weight of the study subjects
Table 3.3. The average age, height, weight of the study subjects
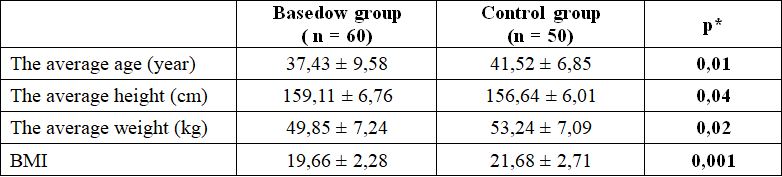
Comment: The average age of the control group was 41.52 ± 6.85 higher than the disease group of 37.43 ± 9.58 (p <0.05). The average height of the control group was 156.64 ± 6.01cm lower than the disease group of 159.11 ± 6.76cm (p <0.05). The average weight of the control group was 53.24 ± 7.09 kg higher than the disease group of 49.85 ± 7.24 kg (p <0.05). The average BMI of the control group was 21.68 ± 2.71 higher than the disease group of 19.66 ± 2.28 (p <0.01).
3.4. Bone mass density and rate of osteoporosis.
Table 3.4. Classification bone mass density according to T-score
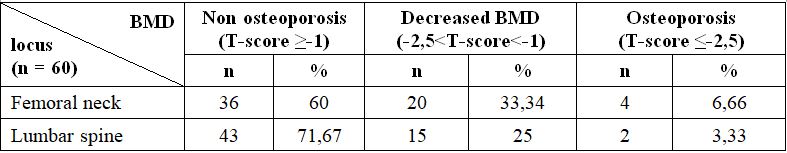
Comment: The proportion of patients with osteoporosis measured at the location of the femoral neck was 4 patients accounting for 6.66%; meanwhile in the lumbar spine position, 2 patients accounted for 3.33%; The percentage of no osteoporosis measured in both the femoral neck and lumbar spine position was over 60%.
3.5. Average value of bone mass density
Table 3.5. Average value of BMD
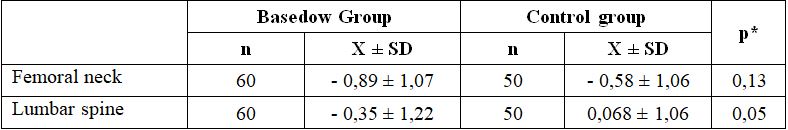
Comments: The average bone mass density of the Basedow group was lower than the control group. When measured at the position of the femoral neck: The bone density in the Basedow group was – 0.89 ± 1.07 (T – score) and in the control group – 0.58 ± 1.06 (T – score) (p> 0.05). When measuring bone mass density at lumbar spine position: The bone density in the Basedow group was – 0.35 ± 1.22 (T – score) and in the control group was 0.068 ± 1.06 (T – score) (p <0.05).
3.6. Characteristics of Goiter level
Table 3.6. Enlargement of the goiter with bone mass density was measured at the position of the femoral neck.
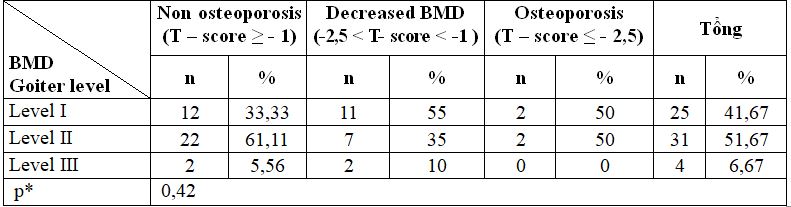
Comment: Comparition the correlation between tumor size and bone mass density classification, the difference between these ratios is not statistically significant with p> 0.05.
4. DISCUSSION
4.1. Characteristics of subjects
The most common age among Basedow patients was from 20 – 29 years old with 36 patients accounting for 60%; while in the control group (Non- Basedow disease), there were 17 patients accounting for 34%; In the control group, the highest age group is 30-39 years, accounting for 56%; In both groups there was no case greater than 50 years old. When comparing, find differences in age group of disease and control groups; We see a statistically significant difference with p <0.05. The average age of the control group was 41.52 ± 6.85 years higher than the disease group of 37.43 ± 9.58 years; This difference was statistically significant with p <0.05. Comparison of our research results with Mai Thi Minh Tam’s study et al. (2002) showed that the similarity of the average age of Basedow group was 35.1 ± 7.7 years [3] .
The gender distribution in both the disease and control groups is predominantly in females; with disease group accounting for 73.33% and control group accounting for 84%; while the male disease group accounted for 26.67% and the control group accounted for 16%; The difference in gender ratio is not statistically significant with p> 0.05.
The average height of the control group was 156.64 ± 6.01cm lower than the disease group of 159.11 ± 6.76cm; This difference was statistically significant with p <0.05. This result was not significantly higher than the result of some studies. Research results of Mai Thi Minh Tam et al. (2002): the average height in the control group was 155.5 ± 4.6 cm and in the disease group was 154.5 ± 4.7 cm [3]. Research by Ngo Thi Mai Xuan et al. (2007) showed that the average height of the control group was 153.16 ± 17.11 cm and the average height of the disease group was 155.8 ± 5.2 cm. This difference was statistically significant with p <0.01 [4].
In our study, the average weight of the control group was 53.24 ± 7.09kg higher than the disease group of 49.85 ± 7.24kg; This difference was statistically significant with p <0.05. This result was higher than the research results of Mai Thi Minh Tam et al. (2002) when the author indicated the average weight of the Basedow group was 43.7 ± 5.3 kg [3]. Compared with the results of Ngo Thi Mai Xuan et al. (2007), our results were lower when the author indicated the average weight of the control group was 56.66 ± 15.98 kg and that of the disease group was 53.61 ± 7.4kg and the difference was statistically significant with p <0.01 [4]. However, our study subjects were male and female patients with Basedow’s disease and the authors’ subjects was only female, so this could lead to these differences.
The average BMI of the control group was 21.68 ± 2.71 higher than the disease group of 19.66 ± 2.28. This difference was statistically significant with p <0.01. Our results are higher than those of Mai Thi Minh Tam et al. (2002) in Basedow female at Bach Mai Hospital with average BMI of 18.3 ± 2.1 [3] and was insignificantly lower than the results of Ngo Thi Mai Xuan et al. (2007) with the BMI of the control group being 23.18 ± 4.32 and the BMI of the disease group was 22.1 ± 2,07 [4].
4.2. Bone mass density and rate of osteoporosis
4.2.1. Bone mass density and rate of osteoporosis
The proportion of patients with osteoporosis measured at femoral neck was 4 patients accounting for 6.66%; meanwhile measuring bone mass density by T – score at lumbar spine position were 2 patients accounting for 3.33%; The rate of no osteoporosis measured in both the femoral neck and lumbar spine position was over 60%. Comparing with the research results of Can Xuan Quy et al. (2011): at the lumbar spine position, 37.04% of patients had osteoporosis; 32.1% of the patients had no osteoporosis and in the femoral neck area 22.22% had osteoporosis and 32.1% had no osteoporosis [5].Thus, in our study, the proportion of patients with osteoporosis at lumbar spine and femoral neck positions was lower than of the author, this might be due to the difference in research object: The authors selected rheumatoid arthritis patients and in our study was Basedow patients. In this study, the author also pointed out that there were many factors that affect the bone mass density of patients with rheumatoid arthritis such as the influence of inflammatory factors, decreased activity due to disease status, hormonal changes. are related to menopause , nutrition , weight loss due to disease, and glucocorrticoid use, especially [5].In the study of Ngo Thi Mai Xuan et al. (2007), the rate of femoral neck’s osteoporosis was similar but the rate of lumbar spine osteoporosis was lower [4]. This could be explained by the fact that the author’s research object was different from our research object. Also in our study it was found that the rate of osteoporosis in the femoral neck was greater than the lumbar spine.
Through many studies, we found that many authors also stated that bone mass decreased and osteoporosis in Basedow patients. Fraser et al. (1971) found that bone mass decreased in hyperthyroidism patients who did not receive antithyroid treatment [6]. Campos et al. (1993) found that in patients with hyperthyroidism, bone density measurements in the spine, neck of the femur and heel bone were all lower than the control group [7]. Diamond (1994) studied 15 patients with Basedow including 6 patients in pre-menopause and 9 patients in the postmenopausal period showing bone loss in the spine and femoral neck [8].
In 1994, Nagasaka and his colleagues studied 10 patients with Basedow’s disease including 7 men and 3 women, an average age of 39.3 ± 2.9 and treatment with antithyroid drugs. Bone was assessed by taking palm bones and measuring bone mass density at the spine. Results in this study, the author found bone destruction and the bones of the hand bone with the bone shell [9].In 1997, Gomez compared bone mass density measured by two methods DEXA and QUS in 24 women Basedow disease measured bone mass density in the spine, femoral neck and heel bone.
Results showed that all three parameters of ultrasound including BUA, SOS and SI in the Basedow group were significantly lower than the control group. Similar results were observed when bone mass density in spine and femoral neck [10]. Jodar (1997) studied 127 patients with hyperthyroidism who measured bone mass density in the spine L2 – L4, femoral neck and Wards triangle by DEXA method and found that bone mass density decreased compared to control group [11]. Mai Thi Minh Tam (2002) stated that studies of bone mass density in patients with hyperthyroidism suggest that there was bone loss and bone loss in every position such as the spine, neck and femur, heels and forearm bones [3].
By the methods of assessing osteoporosis, the authors found that the prevalence of osteoporosis in Basedow patients depends on the method of assessing osteoporosis and thyrotoxicosis level. In 1972, Meunier observed 187 patients with hyperthyroidism on X-ray images and saw that the rate of osteoporosis was 8% [12]. Therefore, bone mass density measurement for Basedow patients was extremely necessary to detect bone mass density reduction and osteoporosis, thereby providing preventive measures and treatment for patients.
4.2.2. Average value of bone mass density
The average bone mass density of Basedow group was lower than the control group; specifically when measured at the position of the femoral neck; bone massdensity in the Basedow group was – 0.89 ± 1.07 (T – score) and in the control group – 0.58 ± 1.06 (T -score), the difference of these two groups was not statistically significant with p> 0.05.
When measured bone mass density at the position of the lumbar spine; Bone mass density in the Basedow group was – 0.35 ± 1.22 (T – score) and in the control group was 0.068 ± 1.06 (T -score), the difference of these two groups was statistically significant with p < 0.05. In the study of Ngo Thi Mai Xuan et al. (2007), the author also showed that the average bone mass density of lumbar spine and femur of the disease group was statistically lower than the control group with p <0,01 [4].
Author Trinh Xuan Trang et al (2014) on Basedow female patients at Phu Tho General Hospital also found that lumbar spine mass density in the disease group was lower than the control group and this difference was statistically significant with p <0.001 [6]. Although our research results were not statistically significant, Basedow patients had average bone mass densitylower than control group. This might besuggest that Basedow’s disease may be the cause of osteoporosis, and therefore, the average bone mass density measured in patients of the disease group would have average valueslower than the control group due to their osteoporosis and decreased bone mass density.
4.2.3. Characteristics of goitre
Results of goitre level with bone mass density measured at the position of the femoral neck show that in patients with decreased bone mass density, the level I was the highest at 55%, the second was 35% and the lowest was level III accounts for 10%, while in patients with osteoporosis, the incidence of level I and II was equal to 50% and no patients with osteoporosis had level III goiter. Comparison to find the correlation between goitre level and bone mass density classification; The difference between these ratios was not statistically significant with p> 0.05. In the study of Trinh Xuan Trang et al (2014) on Basedow female patients at Phu Tho General Hospital, the author also found that 45.8% of osteoporosis patients had level IIgoiters but did not have relationship between goiter level and bone mass density of Basedow patients [13].
REFERENCES
- Đỗ Trung Quân, Nguyễn Thị Hà (2000). Một số nhận xét đặc điểm lâm sàng và cận lâm sàng của Basedow.Tạp chí Y Học, số 11, trang. 96 -98.
- Kanis JA (2002), Diagnosis of osteoporosis and assessment of fracture risk, The Lancet. 359 (9321): p. 1929 -1936.
- Mai Thị Minh Tâm (2002), Nghiên cứu mật độ xương ở bệnh nhân nữBasedow tại Bệnh viện Bạch Mai, Luận văn tốt nghiệp Bác sỹ Chuyên khoa II, Trường Đại học Y Hà Nội.
- Ngô Thị Mai Xuân và cộng sự (2007), Nhận xét mật độ xương ở bệnh nhân nữ đái tháo đường typ 2 và các yếu tố liên quan, Luận văn Bác sỹ Chuyên khoa II, Trường Đại học Y Hà Nội.
- Cấn Xuân Quý và cộng sự (2011), Nghiên cứu mật độ xương ở bệnh nhân viêm khớp dạng thấp, Luận văn Thạc sỹ Y học, Trường Đại học Y Hà Nội.
- Fraser SA, Smith DA, Anderson JB, Wilson GM (1971). “Osteoporosis and fractures following thyrotoxicosis”. The Lancet, 981-983.
- Campos P, Munoz T (1993). “Bone mas in females with different thyroid disorder: influence of menopausal status”. Bone Miner, 21(1), 1-8.
- Diamond T, Vine J and et al (1994). “Thyrotoxic bone disease in women: a potentially reversible disorder”. Thyroid. Summer; 4(2), 143-144.
- Nagasaka S, Sugimoto H and et al (1994). “Antithyroid therapy improves bony manifestations and bone metabolic markers in patients with Graves’ thyrotoxicosis”. Ann Intern Med Jan 1; 120(1), 8-11.
- Gomez Acotto C, Schotz AM and et al (1997). “Hyper thyroidism influences ultrasonores bone measurement on the os calcis”. Clin Endocrinol, 47(3), 279-35.
- Jordar E, Munoz-Torres M and et al (1997). “Bone loss in hyperthyriod patients and in former hyperthyriod patients controlled on medical therapy: influence of aetiology and menopaus”. J Clin Endocrinol Metab, 83(3), 753-9.