 Hội Nội Tiết – Đái Tháo Đường Miền Trung Việt Nam Hội Nội Tiết – Đái Tháo Đường Miền Trung Việt Nam
RELATIONSHIP BETWEEN SERUM GAMMA GLUTAMYL TRANSFERASE AND CARDIOVASCULAR RISK FACTORS IN TYPE 2 DIABETIC PATIENTS
Huynh An Thuyen*, Nguyen Hai Thuy**
*Hue Central Hospital, **Hue University of Medecine and Pharmacy
Background: Serum gamma glutamyl transferase (GGT) activity could reflect several different relevant to pathogenesis of cardiovascular risk factor and has present high prevalence of type 2 diabetes. Objectives : the aim of study was to assess the association between serum gamma glutamyl transferase and some cardiovascular risk factors in type 2 diabetes. Methods: 194 type 2 diabetic patients were examined the Serum GGT by enzymatic photometry method. The relationship between serum GGT and some cardiovascular risk factors in diabetes type 2 was evaluated. Results: The serum GGT concentration was significantly elevated in type 2 diabetic patients compared to patients without diabetes, was significantly higher in patients with bad glycemic control (HbA1c ≥ 7%) compared to patients with good glycemic control ( HbA1c < 7%). There was significant difference in serum concentration of GGT between male and female (77,61±57,32 U/L and 50,70± 38,62 U/L, p< 0,001). between smokers and non smokers (71,24 ± 40,70 U/L and 53,10± 43,10 U/L, p < 0,05). betwween bad HbA1c and good HbA1c (64,90±51,13 U/L and 45,52±30,97 U/L, p< 0,05). Conclusions: Although the mechanism are not clear but GGT also considered a cardiovascular risk factor in T2DM.
Main correspondence: Huynh An Thuyen
Submission date: 1st August 2018
Revised date: 18th August 2018
Acceptance date: 31th August 2018
1.INTRODUCTION
Diabetes is becoming health problem worldwide which prevalence more and more increase. 70% mortality in diabetic patients sdue to cardiovascular complications [21]. Researches are identifying risk factors of cardiovascular diseases increasing with diabetics. Serum gamma glutamyl transferase (GGT) is not only marker of hepatic diseases but also having role of atherosclerotic pathology such as myocardial infarction, stroke, hypertension and metabolic syndrome…[30], [58]. Originating these causes, we do this theme for two reasons including to define concentration serum GGT in type 2 diabetic patients and to evaluate the relationship bteween concentration of serum GGT and cardiovascular risk factors in these diabetic patients.
2. PATIENTS AND METHODS
194 type 2 diabetic patients at Hue Center Hospital from 07/2013 to 08/2014. In this study, we use standard fasting blood glucose and/or HbA1c.
– Exclusion standard: Hepatic diseases, drinking alcohol.
2.1. Methods
– Design: Description cross methods.
– Variables
- Age: Purpose: Defined age group have risk factor than.
- Gender: Purpose: Defined which sex having risk factor than.
- Smoking: Smoker consist of patients who being smoke or stopped smoking withinless than one year [16].
- Do exercise: Consist of patient who do exercise at least 5 days/week and >30 minutes in one day.
- Diabetes Mellitus duration:
Three groups:< 5 yr; 5 – 10 yr; > 10 yr.
- Hypertension: Systolic blood pressure (SBP) ≥ 140 mmHg and/or diatolic blood pressure (DBP) ≥ 80 mmHg (ADA 2014) [14].
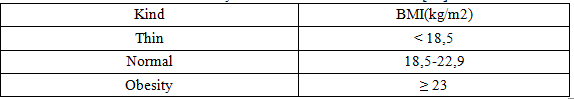
- BMI
Classified obesity in Asia aldult of WHO 2000 [13]
- Waist: Obese men when waist ≥ 90 cm for men and waist ≥80 cm for women [34].
- Bilan lipid: Standars of NCEP–ATP III (2001) have risk factor when: TC ³ 5,2 mmol/l; HDL-C < 1,03 mmol/l; LDL-C ³ 2,6 mmol/l; TG ³ 1,7 mmol/l[52].
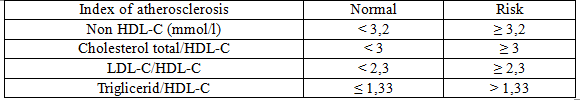
- Indices of atherosclerosi
- Fasting Blood Glucose (FBG): Treatments goal ADA 2014 [19].
FBG achieve goal when: 3,9 – 7,2 mmol; FBG doesn’t achieve goal when: ≥ 7,2 mmol.
- HbA1c: treatments goal ADA 2014 [19].
- Achieve goal: HbA1C < 7%; Doesn’t achieve goal: HbA1C ³ 7%.
- GGT: To quantitative about spectrum absorption methods, based on control group we divided into 3 small group.
Concentration GGT:Group 1≤ + SD; Group 2 từ + 1SD đến + 2SD; Group 3 > + 2SD
2.2. Data analysis: Statistical analysis was performed using SPSS version 16.0.
3. RESULTS
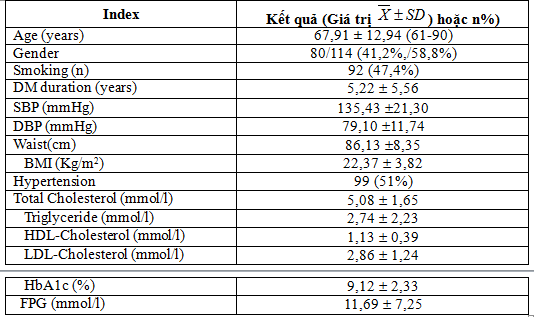
Tablet 3.1. Clinical and laboratory characteristics of the subjects (n=194)
 Tablet 3.2. Concentration of serum GGT
 Nowadays, we had identified that increase of concentration serum GGT was single predict for some risk factor cardiovascular in hypertension, DM or obesity, persons who have high concentration serum GGT have high mortality than others [20], [43], [47].
Study 194 patients, serum GGT concentration means 61,80±48,93 U/L and control group means 33,23 ± 27,10 U/L (p<0.001). According to N.Đ.Trường’s research (2013), serum GGT concentration in metabolic sydrom means 51,17± 45,36 U/L. Subhasish Dan’s research (2012), serum GGT concentration in DM means 42,23± 9,06 U/L [55]. Some studies recorded serum GGT concentration in DM, metabolic syndrome are significantly higher than control group.
Tablet 3.3. Classification of serum GGT concentration
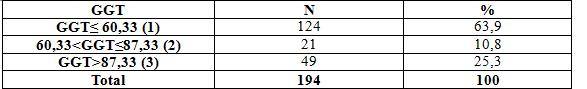 We devide disease group to 3 group according to serum GGT concentration: Group 1 ≤ + SD(GGT≤60,33 U/L), consist of 124 patients, proportion 63,9%; Group 2 from + 1SD to + 2SD(60,33<GGT≤87,43), consist of 21 patients, proportion 10,8%; Group 3 > + 2SD (GGT>87,43), consist of 49 patients, proportion 25,3%.
Most of patients have serum GGT concentration mean lower than 60 IU/L proportion is 63,9% ( + SD).
Tablet 3.4. Age and serum GGT concentration
 .P<0,05.
According to study, youngest patient is 38 years old and oldest is 100 years old
The age of patients in group 1(GGT <60,33 UI/L ( + SD)) is 69,21±11,82 yrs old, in group 2(GGT from + 1SD to + 2SD(60,33<GGT≤87,43)) is 67,71±15,29 yrs old and in group 3 (GGT > + 2SD (GGT>87,43)) is 64,69±14,25 yrs old. The group which serum GGT concentration lowest have highest age and contrary.
C.Meisinger’s study (2005) identified group which higher serum GGT have higher age [22]. Nakanishi’s study (2004) devide disease group to 5 group follow serum GGT concentration: < 15 U/L, 15-21 U/L, 22-31 U/L, 32-52 U/L và > 52 U/L, mean age 46,5± 6,7, 47,3± 6,4, 47,0± 6,3, 47,6± 6,1 và 47,9 ± 5,7, respectively (p < 0,001), mean age significantly increase in group which higher serum GGT concentration [47]. So, our study are different another studys in the world, we explain that serum GGT concentration relate with metabolic disorder than age.
Tablet 3.5. Serum GGT concentration with gender
 In our study, there are 114 females, 58.8% and 84 males, 41,2%. In male, mean serum GGT concentration is 77,61±57,32 U/L. it’s significantly higher than female, 50,70± 38,62 U/L. N.Đ.Trường’s study (2013) show that the serum GGT concentration in male is higher than female [16]. It’s the same Sassan Haghighi’s study (2010) [52].
Tablet 3.6. Serum GGT concentration with life style
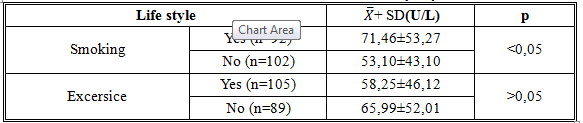 In this study, serum GGT concentration in smoking group is 71,46±53,27 U/L, higher than non-smoking group, 53,10 ± 43,10 U/L with p<0,05. But it’s not different between excersise and non excersice group with p > 0.05. Following study of Giacomo Zoppini (2008) and Marco Nuti (2012), serum GGT in smoking group and excirsice group is higher than others [29], [44]. In Nakanishi’study (2004), there is relationship between proportion of smoking and GGT but it’s not in excersice group. So, our study is the same with another in the world.
Tablet 3.7. Serum GGT concentration with waist circumference and BMI
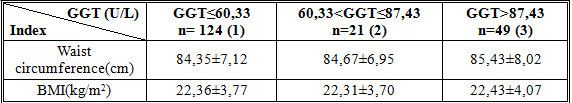 Average of BMI in 3 groups which are serum GGT <60,33 U/L, 60,33-87,43 U/L and> 87,43 U/L, are respectively 22,36 ± 3,77 kg/m2, 22,31 ± 3,70 kg/m2 và 22,43 ± 4,07 kg/m2. It’s not significant (p> 0,05). However, there is increasing average of BMI in each groups.
In C.Meisinger’study (2005) BMI increase significantly with GGT level (p < 0,001), this study identified that serum GGT have strong relationship with risk factor DM in two gender [22].
In Giacomo Zopponi (2008), average BMI in 4 group which are serum GGT < 19 U/L, 19-29 U/L, 30-52 U/L and> 52 U/L, are respectively: 27,8± 4,7 kg/m2, 28,2± 4,6 kg/m2, 29,2±5,2 kg/m2 và 29,7 ± 6,3 kg/m2. It’s is significant (p< 0,001). Index everage BMI significantly increase with GGT level. This study identified: increasing GGT are related with increasing risk factor of BMI, bilan lipid disorders and FPG but reverse is not correct [29].
Tablet 3.8. Serum GGT concentration with FGB and HbA1c
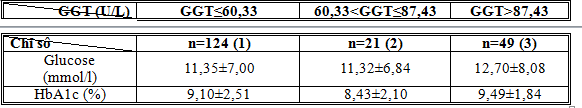
- Glucose concentration in 3 group with GGT level ≤ 60,33 U/L, 60,33-87,43 U/L và > 87,43 U/L are: 11,35 ± 7,00 U/L, 11,32 ± 6,84 U/L và 12,70 ± 8,08 mmol/l, glucose concentration increase with GGT level, it’s not significant. Nakanishi’s study (2004): research serum GGT concentration with risk factor of metabolic sydrome and DM in aldult Japanese, glucose concentration significantly increase with GGT level (p < 0,001) [47]. Sassan Haghighi (2010) study relationship between serum GGT with tolerance in DM: mean glucose concentration proportional increase with GGT level (p < 0,05) [51].Serum GGT concentration with FBG
Marco Nuti (2012) study relationship between serum GGT with thickness endothelium of carotid artery in DM with hypertension: glucose concentration increase with GGT level in two gender [44].
- Serum GGT concentration with HbA1c
 Mean GGT in group which HbA1c ≥ 7 is 64,90 ± 51,13 U/L higher than group which HbA1c < 7 (45,52 ± 30,97 U/L), it’s is significant p< 0,05. This result is same Giacomo Zoppini’s study (2008) [29]. According Sassan Haghighi’s study (2010): high serum GGT be seen as high risk factor in DM [51]. Giacomo Zoppini’s study (2008), mean HbA1c in groups with GGT < 19 U/L, 19-29 U/L, 30-52 U/L and > 52 U/L are 7,2 ± 1,1%, 7,3± 1,3%,7,4 ±1,3% và 7,5 ± 1,4% respectively (p < 0,001).
Tablet 3.9. Serum GGT concentration with bilan lipid
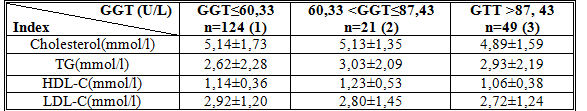 a. Serum GGT concentration with total cholesterol
Mean total cholesterol with GGT ≤ 60,33 U/L, 61-87 U/L and GGT > 87,43 U/L are 5,14± 1,73 mmol/l, 5,13± 1,35 mmol/l and 4,89± 1,59 mmol/l respectively, it’s not significant.
Sassan Haghighi’s study (2010), total cholesterol (TC) concentration in group with GGT level GGT < 16,5 U/L; 16,5-21,9 U/L; 22-30,5 U/L và > 30,5 U/L are 187,7± 30,8 mg/dl; 193,9± 34,1 mg/dl; 197,5± 42,3 mg/dl và 208,8± 47,8 mg/dl respectively (p < 0,05), follow this study TC significantly increase with GGT level [51]. My study contract to this study, explained for this result we thought that most of patient have low standard of living; thus disease duration more longer, the malnutrition rate more higher; this due to concentration TC low.
b.Serum GGT concentration with Triglycerid
Mean triglycerid (TG) concentration in group with GGT ≤ 60,33 U/L, 60,33-87,43 U/L and GGT > 87,43 U/L are 2,62± 2,28 mmol/l, 3,03± 2,09 mmol/l và 2,93± 2,19 mmol/l respectively, mean TG significantly increase with GGT level, but this study do not identify that serum GGT is a risk factor of increase TG. According Sassan Haghighi’s study (2010), mean TG concentration in group with GGT level < 16,5 U/L; 16,5-21,9 U/L; 22-30,5 U/L và > 30,5 U/L are 123,3± 65,4 mg/dl; 152,3± 65,4 mg/dl; 181,8± 107,7 mg/dl và 193,2± 91,8 mg/dl respectively (p< 0,05), so Sassan Haghighi show that mean TG concentration significantly increase with GGT level [51].
Marco Nuti’s study (2012), decise patients about 4 groups due to GGT level: GGT < 15 U/L và ≥ 15 U/L in female and GGT < 27 U/L và ≥ 27 U/L in male, mean TG concentration are 81 mg/dl, 108 mg/dl, 102 mg/dl và 126 mg/dl respectively, have increase TG concentration with GGT level [44].
4. Serum GGT concentration with HDL-C
In my study, mean HDL-C concentration in group with GGT ≤ 60,33 U/L, 60,33-87,43 U/L and GGT > 87,43 U/L are 1,14± 0,36 mmol/l, 1,23± 0,53 mmol/l and 1,06± 0,38 mmol/l respectively. We find that mean HDL-C concentration decrease with GGT level (p> 0.05). This result are similar with Marco Nuti’s study (2012) and Sassan Haghighi’s study (2010) [44], [51].
According Giacomo Zoppini’s study (2008), mean GGT concentration with GGT level < 19 U/L, 19-29 U/L, 30-52 U/L and GGT > 52 U/L are 1,4± 0,4 mmol/l, 1,4 ± 0,3 mmol/l, 1,4± 0,4 mmol/l and 1,4 ± 0,4 mmol/l, mean GGT concentration does not change with GGT level, p > 0,05 [29].
5. Serum GGT concentration with LDL-C
According to Giacomo Zoppini’s study (2008), mean LDL-C in group 1 is lower than three group another (group 2,3,4) and LDL-C in three group are equal (3,0 ± 0,8 mmol/l), the difference isn’t significantly p>0,05. To guidline of NCEP-ATP III, LDL-C is first target in control dyslipidermia, concentration LDL-C is lower than 2,6 mmol/l is the target to decrease coronary disease in rick patients, which have diabetic patients.
Tablet 3.10. Serum GGT concentration with atherogenesis index
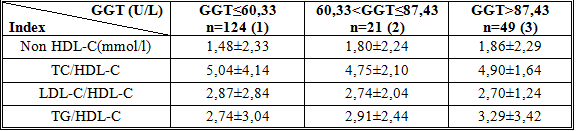 The difference of concentration non-HDL, TC/HDL-C, LDL-C/HDL-C, TG/HDL-C in three groups of GGT aren’t significant p>0,05.
4. CONCLUSIONS
Mean serum GGT concentration in type 2 diabetic patients is higher than non T2DM.
Serum GGT concentration in T2DM patients with bad control blood glucose higher than good control BG. There were difference in mean GGT concentration between male and female (77,61±57,32 U/L vs 50,70± 38,62 U/, p< 0,001), between smokers and non smokers (71,24 ± 40,70 U/L vs 53,10± 43,10 U/L, r, p < 0,05), and bad HbA1c and good HbA1c (64,90±51,13 U/L vs 45,52±30,97 U/, p< 0,05).
Although the mechanism are not clear but GGT also considered a cardiovascular risk factor in DM. Therefor, GGT is not only a old marker in alcohol hepatis but also new marker in DM in my country and the world. The diabetics type 2 in hospital need to quantitive concentration GGT serum order to find the closely relationship between GGT and cardiovascular in these patients.
REFERENCES
- Nguyễn Hải Thủy (2009), “Rối loạn lipid máu”, Giáo trình sau đại học chuyên ngành Nội tiết và chuyển hóa, Nhà xuất bản Đại học Huế, tr. 221 –
- Hồ Huỳnh Quang Trí (2013), “Cập nhập 2013 về điều trị đái tháo đường của ADA”, Chuyên đề tim mạch học, Viện tim mạch TP. HCM.
- Nguyễn Đức Trường (2013), Nghiên cứu hoạt độ Gamma Glutamyl Transferase huyết thanh ở bệnh nhân có hội chứng chuyển hóa, Luận văn Bác sĩ chuyên khoa cấp 2, Trường Đại học Y Dược Huế – Đại học Huế.
- American Diabetes Asociation (2013), “Standars of medical care in diabetes”, pp. 514-527.
- Bernd Stratmann, Diethelm Tschoepe (2011), “Heart in Diabetes: Not only a Macrovascular Disease”, Diabetes Care, 34 (2), S. 138.
- Meisinger, H.Lowel, M.Heier, A.Schneider, B.Horand, for the kora study group (2005), “Serum γ-glutamyl transferase and risk of type 2 diabetes mellitus in men and women from the general population”, Journal of Internal Medicine, 258(6), pp. 527–535.
- Giacomo Zoppini, Giovanni Targher, Maddalena Trombetta, Giuseppe Lippi and Michele Mugge (2008), “Relationship of Serum γ-Glutamyl transferase to Atherogenic Dyslipidemia and Glycemic Control in Type 2 Diabetes”, Article Epidemiology, 17(2), 370-374.
- Scott M. (2007), “Gamma Glutamyl Transferase another biomarker for metabolic syndrome and cardiovascular risk”, Arterioscler Thromb Vasc Biol, 27, pp.4-7
- LuXY, WangZD, YangYM, et al (2012), “Plasma gamma glutamyl transferase level as a risk factor in elderly patients with hypertension or hypertension with diabetes mellitus”, Diabet Med, 22(9), pp. 1130-1140.
- Marco Nuti, Paolo Spontoni,et al (2012), “Lack of relationship between ciuculating gamma glutamyltransferase levels and carotid intima media thickness inhypertension and diabetes patients”, Vascular Health and Risk management, 8, pp. 275-281.
- Noriyuki Nakanishi, Kenji Suzuki, Kozo Tatara (2004), “Serum gamma glutamyltransferase and risk of metabolic syndrome and type 2 diabetes in middle Japanese men’’, Diadetes Care, 27(6), pp. 1427-1432.
- Sassan Haghighi, Massoud Amini, Zahra P., et al (2010), “Relationship between gamma –glutamyl transferase and glucose intolerance in first degree relatives of diabetics patients”, Original Article, 16(2), pp. 123-129.
- Scott M. Grundy, Diane Becker, Richard S. Cooper, D. Roger Illingworth., et al. (2002), “Third Report of the National Cholesterol Education Program (NCEP) Expert Panel on Detection, Evaluation, and Treatment of High Blood Cholesterol in Adults (Adult Treatment Panel III) Final Report”, Circulation, 106, pp. 3413 – 3421.
- Subhasish Dan, Indranil Banerjee, Himangshu Roy, Shiuli Roy, Tamoghna Jana, and Satrajit Dan (2012), “Association Between Serum Gamma-glutamyl Transferase Level and Hypertension in Indian Adults: A Population Based Cross-Sectional Study”, N Am J Med Sci,4(10), pp. 496–498.
- Gohel MG, Chacko AN. “Serum GGT activity and hs- CRP level in patients with type 2 diabetes mellitus with good and poor glycemic control. An evidence linking oxidative stress, inflammation and glycemic control”, Journal of diabetes and metabolic disorders.2013;12(56):1-8.
- Iqbal A, Iftikhar U, Ali FA, Memon S, Zuberi N. “Comparison of gamma glutamyl transferase in normal and in type 2 diabetics”, 2010;60(11):945- 948.
- Meisinger C, Lowel H, Heler M, Schnelder A, Thor and B for the KORA Study Group: Serum gamma-glutamyl transferase and risk of diabetes mellitus type 2 in men and women from the general population. J Intern Med 2005;258:527- 535.